| title | description | url | theme | class | ||
|---|---|---|---|---|---|---|
Python external modules and intro to numpy |
Intro to data science with Python |
uncover |
|
- A Python module is a package that provides access to functions, variables, and data within your workspace.
- Modules extend the Python standard library.
- Modules are kind of like Python's apps.
- AKA: library, package, toolbox, toolkit
- There are two types of modules you can use in your Python programs: built-in modules and modules that you install using
pip, which is like Python's app store. - A list of built-in modules may be found here.
- There are hundreds of thousands of installable modules. Googling what you're looking for is a good place to start. Or you can do a search here.
- The easiest way to install Python modules on your local machine is using the
pipcommand from within Terminal:
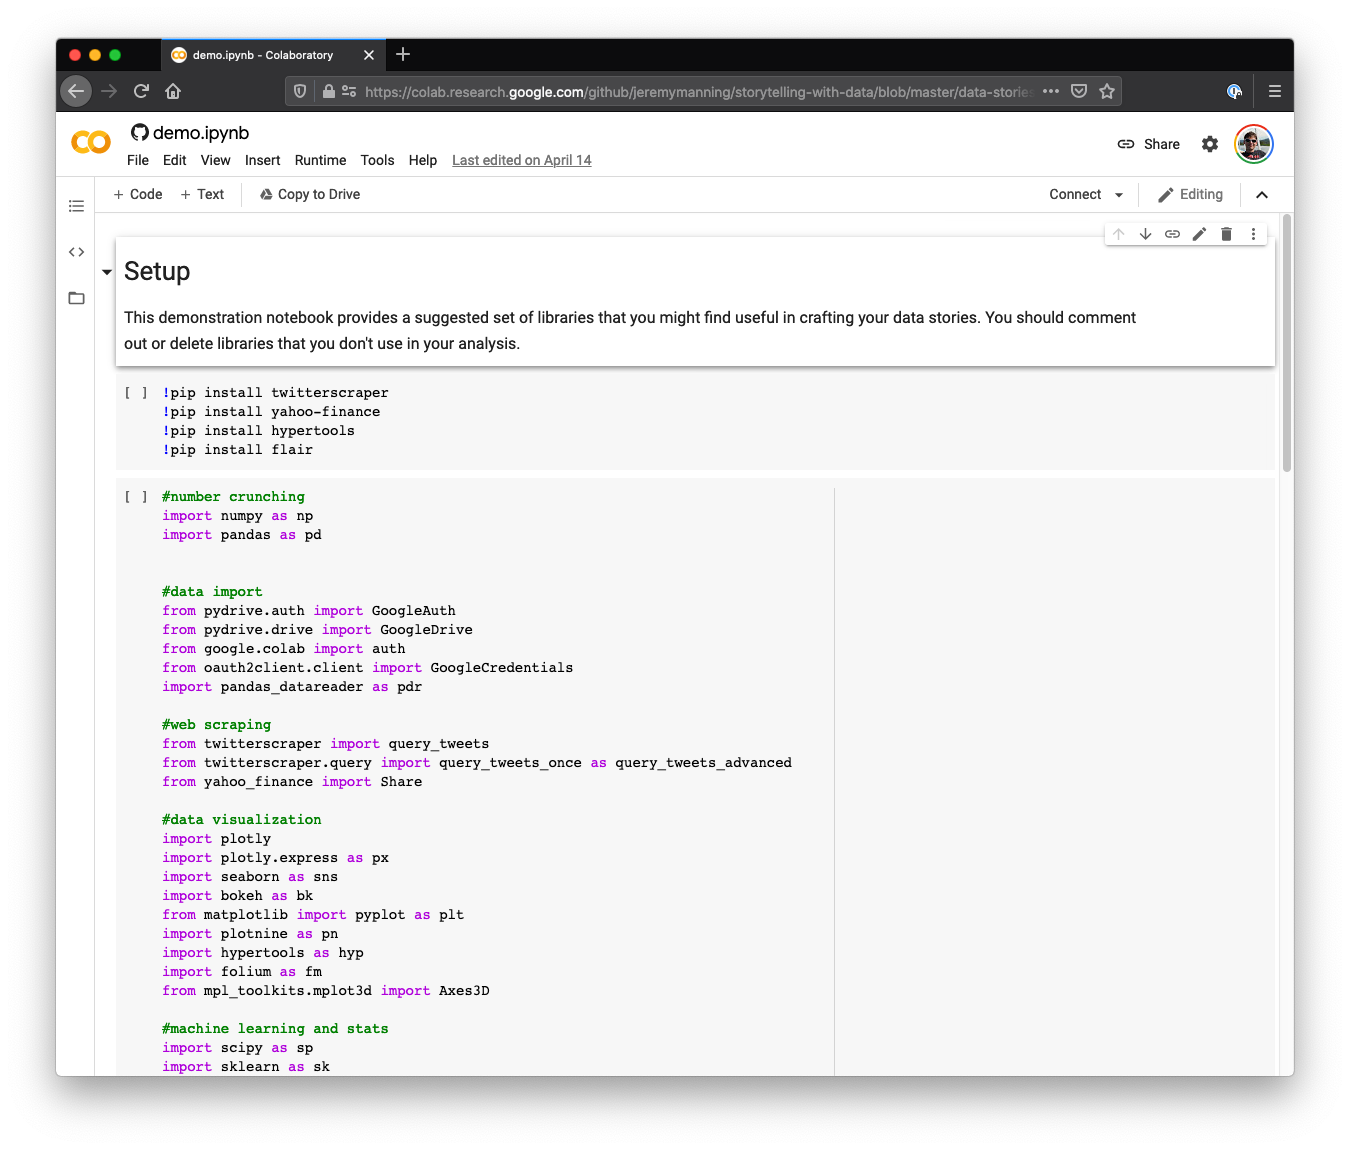
pip install --user hypertools- Within a Colaboratory notebook you can call Terminal commands (including
pip) by putting a!in front of the command in a code cell:
!pip install timecorr- To get a list of the (many!) already-installed modules from within Colaboratory, type:
!pip freeze- In a "regular" Terminal session (e.g., on your local machine), just omit the
!
import itertools
import os, sys
import numpy as np
from math import log
from glob import glob as lsdir- You probably won't write or publish your own packages in this course.
- But, in case you want to see how packages are made, here is my lab's tutorial for writing one (and making it installable via
pip).
- Python is a nice language, but many others are nice too
- Python's enormous library of installable packages is why Python stands out
-
Wrangling data: getting the data from the format it's in to the format you need it in
-
Analyzing data: carrying out statistical tests, machine learning
-
Modeling data: fitting existing models to your data and/or implementing your own models
-
Visualizing data: creating figures
-
...and nearly anything else you can imagine!
Storytelling with Data project template
Storytelling with Data project template
- Real-world datasets are often messy:
- Missing or inconsistent data
- Organized in ways that are difficult or inefficient to work with
- The point of data wrangling tools is to make data easier and more efficient to work with
- NumPy stands for NUMerical PYthon. It's the foundation of nearly every data science tool and analysis in Python.
- Introduces a new type of object called an
array(plus some others). These objects store n-dimensional tables of numbers (i.e., vectors, matrices, and tensors).
- Also introduces a bunch of functions for efficiently working with
arrayobjects, and with lots of other useful linear algebra and calculus functions, random number generators, etc. - Official tutorials and documentation may be found here.
- Open up a scratch notebook in Colaboratory and follow along!
import numpy as np

>>> a = np.array([1, 2, 3])
>>> a
array([1, 2, 3])
>>> a + 2
array([3, 4, 5])a.ndim: the number of axes (dimensions) of the arraya.shape: returns atupleindicating the size of the array in each dimensiona.size: the total number of elements in the arraya.dtype: the data type of the array's elements
a.reshape: reshapes the array into a new array of the given size- Slicing:
arrayobjects support slice notation similar tolistobjects. NumPyarrayobjects may be sliced along each dimension simultaneously. np.ravel: flattens thearrayinto a 1-D vector
np.repeat,np.tile: repeat elements of an array, or copy the entire array and merge with itselfnp.vstack,np.hstack,np.stack,np.concatenate,np.block: combine multiple arraysnp.hsplit,np.vsplit,np.dsplit,np.split: split an array into partsa.sort: returns a sorted copy ofa
np.arange: works like therangefunction, but returns anarrayobjectnp.linspace,np.logspace,np.mgrid,np.ogrid: createarrayof spaced out values
np.zerosandnp.ones: produce anarrayof the given size, filled with all 0s or 1snp.zeros_like,np.ones_like:arrayof same size as input, filled with 0s or 1s
- Many standard math and stats functions you might expect
np.sin,np.cos,np.exp,np.sqrt,np.dot,np.outer,np.mean,np.std, etc.- These all operate on
arrayobjects, but can also be used for other built-in datatypes likeintandfloat.
- Most NumPy functions automatically apply to every element in an
array(without a loop!) - This can make for very efficient and clean code:
x = np.arange(10) ** 2vs
x = []
for i in range(10):
x[i] = i ** 2np.random.rand,np.random.randn,np.random.randint: generate random numbers.np.random.choice: choose random element(s) from a 1Darray.
a.all():Trueiff every element of the array isTruea.any():Trueiff any element of the array isTruea.argmax,a.argmin: return the max or min values (potentially along each dimension)a.cumsum,a.cumprod: return an array of the same size asa, but storing the cumulative sum or product of each successive element ofaalong the given dimension
- When you slice an array, it returns a pointer to the original data, called a
view. - If you change the data in the original array, the values in the slice will change too (and vice versa).
- If you don't want this to happen, use
copy:a.copy(): creates a newarraywith the same data
- If you're finding that your data is being changed in strange ways, a good thing to check first is that you're dealing with
arrayobjects correctly. - Only copy data when you need too-- otherwise you'll be wasting memory by storing redundant copies of the same thing.
- Create an
arrayof ones with 10 rows and 5 columns
- Create a 4 by 7
arrayof randomints between 6 and 30- Find the rows and columns of all values greater than 10 (
np.where)
- Find the rows and columns of all values greater than 10 (
- Create a 4 by 7
arrayof randomints between 6 and 30- Write a function that checks if any of the values are equal to 30.
- If so, the function should print "The array contains at least 1 30!"
- If not, the function should print "No 30s were found"
- Then return the number of times 30 appeared in the array
- Write a function that checks if any of the values are equal to 30.
- Create an
arraycontaining the first 10 cubes starting from 1 (i.e., 1, 8, 27, etc.) - Create a function that returns an
arraycontaining the square roots ofnevenly spaced values between to integers,xandy. (Your function should accept 3 inputs:x,y, andn.) Hint:np.linspace
- Create a 3 by 4 by 5
arrayof random numbers chosen uniformly between 0 and 1.- Sort the values in ascending order and reshape the
arrayinto a new 20 by 30array - Print out the 10th row
- Print out rows 5 through 9 (inclusive) of columns 20 through 25 (use slice notation!)
- Sort the values in ascending order and reshape the
- Create two
arrayobjects, each filled with random draws from the unit Gaussian distribution (np.random.randn):ashould be 5 by 7bshould be 10 by 7
- Create a new
array,c, comprisingastacked on top ofb
- Reshape
cinto a column vector. Hint:np.ravel. - Create a new
array,d, comprisingcstacked horizontally 5 times. Hint:np.tile. - Create a new
array,e, that repeats each element ofd2 times in a row (it should have twice as many rows and columns asd). Hint:np.repeat.
- Most (all?) data may be represented as matrices, so
arrayobjects are highly generalizable. - Suppose you had a dataset, like a huge spreadsheet of measurements. How could you use NumPy to start understanding your data?
- Think about what is or isn't intuitive about NumPy. Why might things have been set up the way they are? Can you articulate any points of confusion?
- Fluency with NumPy will help you understand and manipulate data easily.


