Skip to content
New issue

Have a question about this project? Sign up for a free GitHub account to open an issue and contact its maintainers and the community.

By clicking “Sign up for GitHub”, you agree to our terms of service and privacy statement. We’ll occasionally send you account related emails.

Already on GitHub? Sign in to your account

Add more analysis in the completed run #3253

Closed
rkendar opened this issue Jun 3, 2020 · 6 comments
Closed

Add more analysis in the completed run #3253

rkendar opened this issue Jun 3, 2020 · 6 comments
Assignees

Comments

@rkendar
Copy link

rkendar commented Jun 3, 2020

Hi Bcbio Team,

Can I add more analysis after the bcbio pipeline is completed? For example, in my yaml file, I specified variantcaller: [mutect2, strelka2, freebayes], then the pipeline run and finished. But I want to add svcaller: [cnvkit, manta]. Is it possible to continue the additional analysis from that completed run? Or I have to start over again?

If it is possible to continue, is it simple add the additional analysis to yaml file then bcbio will automatically recognise/cache which analysis was done/not?

Thank you.

@naumenko-sa
Copy link
Contributor

Hi @rkendar!

Yes, as a general rule, if you add new analysis options, bcbio will run more analyses. Just don't delete work dir of the project. Sometimes, if you changed parameters influencing a particular step,
you might want to delete the corresponding dir in work to re-calculate it. For example, if you generated more QC sources for multiqc, you need to delete work/qc/multiqc dir to update it in a new run.

Sergey

@naumenko-sa naumenko-sa self-assigned this Jun 3, 2020
@rkendar
Copy link
Author

rkendar commented Jun 5, 2020

Hi Sergey @naumenko-sa ,

Great! Thank you so much for your answer. I am testing now as your suggestion. And it works well!
One more thing I wanna ask is, is there any report generated by bcbio that shows how long each analysis run? For example, like how long Mutect2 run, Strelka2 run, etc.

I know bcbio generates 3 log files that have time info for each stage, but it is quite difficult to gather a summary for each tool runtime. Do you have any suggestions?

Thank you!

@roryk
Copy link
Collaborator

roryk commented Jun 5, 2020

Hi @rkendar,

We don't track each individual tools runtime, unfortunately. That would be good to add but it would take a little bit of work to do. We could do this since almost all of the calls out to the command line are via the do.run function. At one point had this type of logging indo.run here: https://github.com/bcbio/bcbio-nextgen/blob/master/bcbio/provenance/diagnostics.py and here: https://github.com/bcbio/bcbio-nextgen/blob/master/bcbio/provenance/do.py#L16 but as you can see it hasn't been touched in forever. biolite looks abandoned too so this would have to be reworked: https://pypi.org/project/biolite/

So no, we don't track the individual tools runtime but we theoretically could. It would be a useful thing to add.

@amizeranschi
Copy link
Contributor

amizeranschi commented Jun 6, 2020

@rkendar

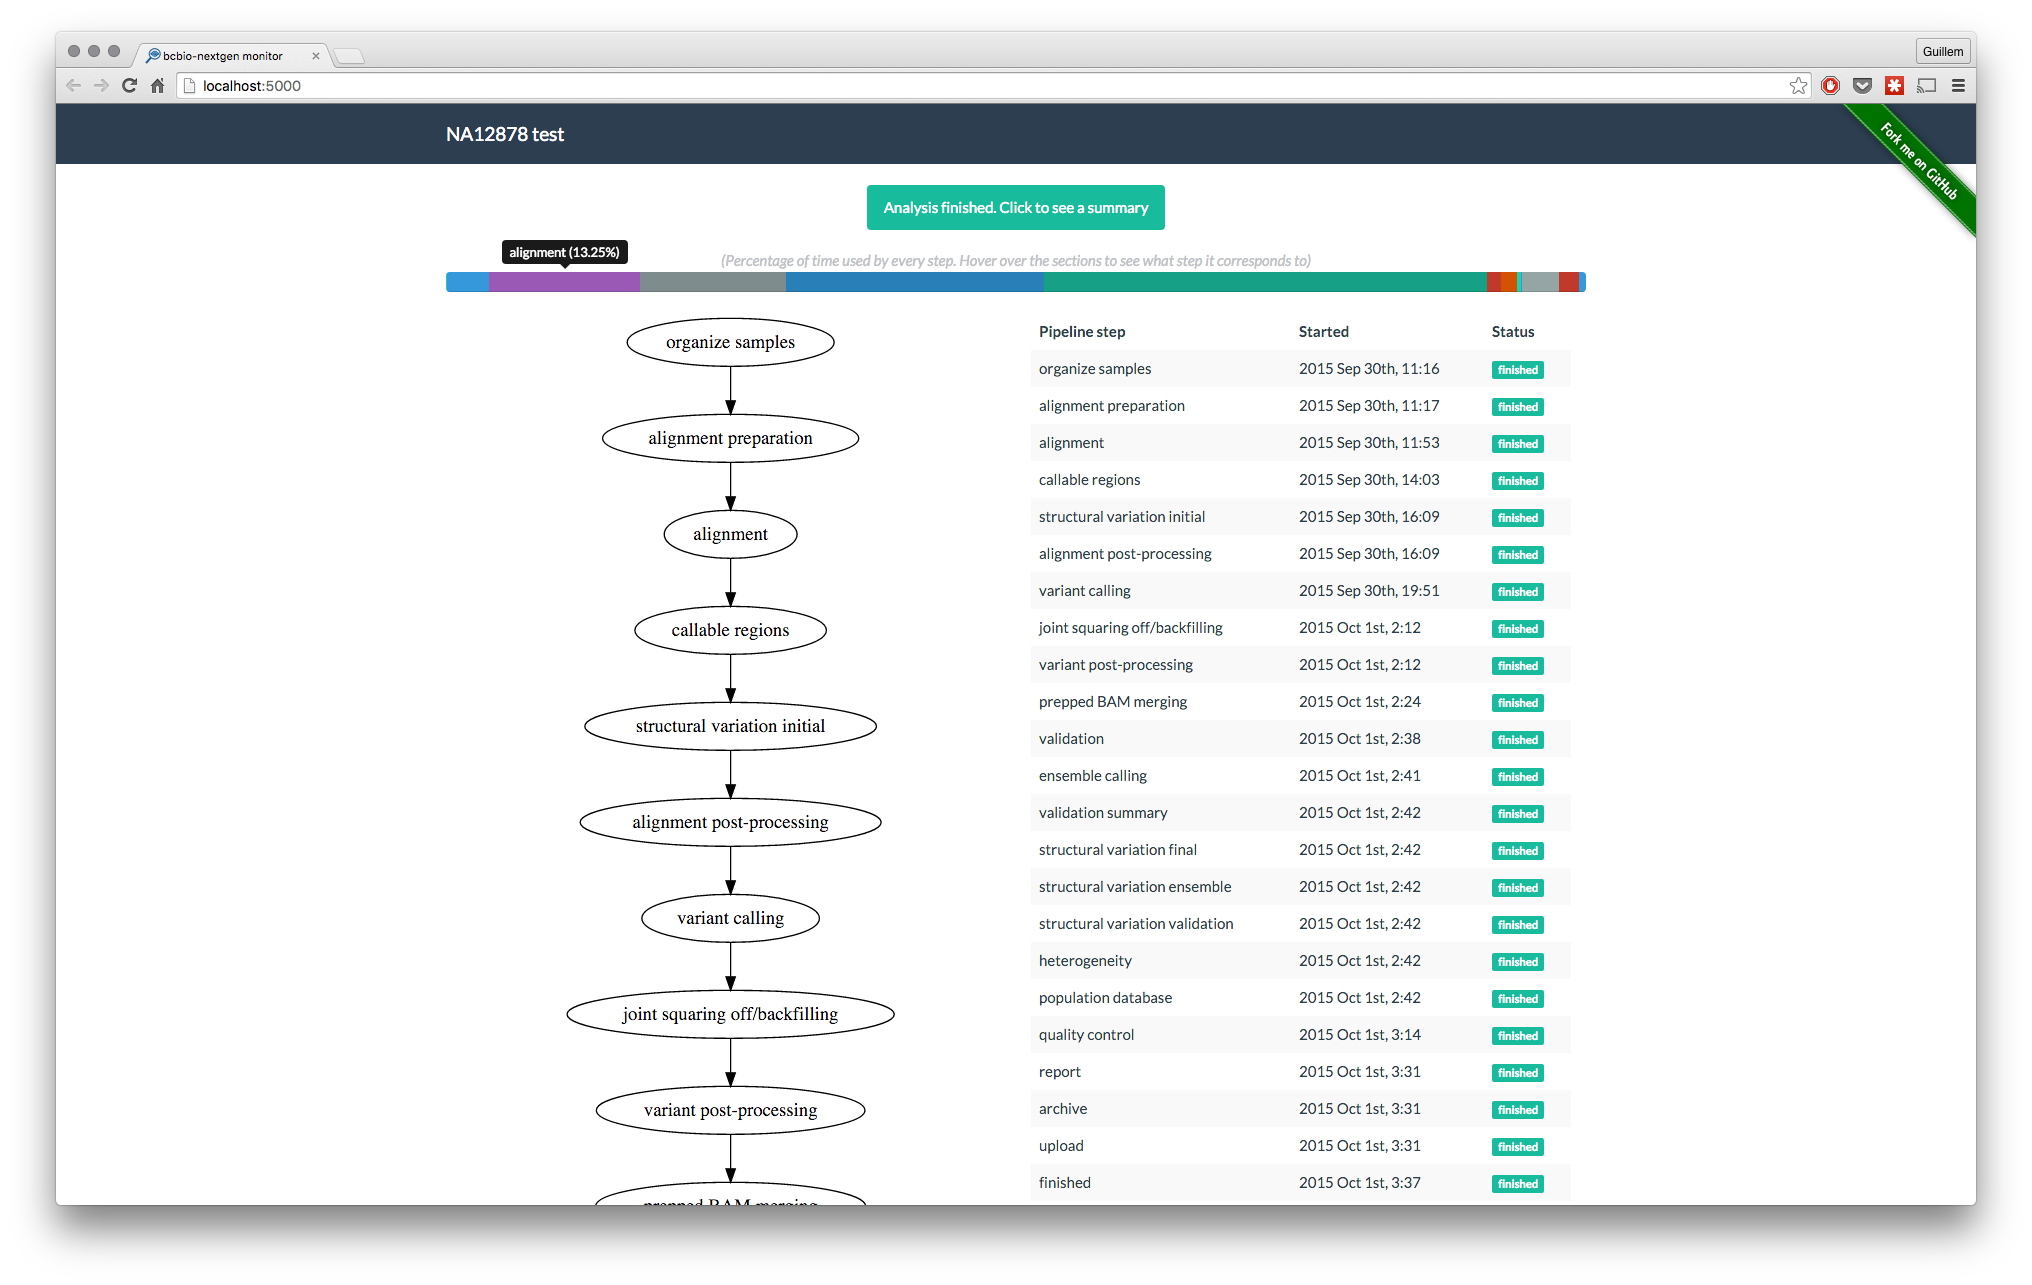
In the mean time, you could have a look at bcbio-monitor: https://github.com/guillermo-carrasco/bcbio-nextgen-monitor.

It's an older tool based on Python2, but it is still compatible with current debug log files created by bcbio_nextgen. It's probably easiest to install it via bioconda and pip, with a few extra custom edits to make it compatible with the newest versions of its dependencies:

bcbio_path=/path/to/bcbio_nextgen
cd ${bcbio_path}
wget https://repo.continuum.io/miniconda/Miniconda2-latest-Linux-x86_64.sh
bash Miniconda2-latest-Linux-x86_64.sh -b -p ${bcbio_path}/extra2
ln -s ${bcbio_path}/extra2/bin/conda ${bcbio_path}/extra2/bin/extra_conda2
${bcbio_path}/extra2/bin/pip install bcbio-monitor pytz python-dateutil
## edit a script for bcbio monitor to make it compatible with the latest dependencies
sed -i "s/from gevent.wsgi import WSGIServer/from gevent.pywsgi import WSGIServer/g" ${bcbio_path}/extra2/lib/python2.7/site-packages/bcbio_monitor/cli.py
export PATH=$PATH:${bcbio_path}/extra2/bin

Then you just run it while feeding a bcbio debug log file as input:

bcbio_monitor --local /path/to/work/log/bcbio-nextgen-debug.log

It should open a new browser window which shows the starting times for each of bcbio's analysis steps, like this: https://raw.githubusercontent.com/guillermo-carrasco/bcbio-nextgen-monitor/master/docs/images/monitor.png. You can then easily compute the wall times for the steps/tools that you're interested in.

@naumenko-sa
Copy link
Contributor

Thanks everyone for the discussion! Adding to the 'new functionality' list.

@rkendar I still was able to profile some bcbio runs by just parsing bcbio-nextgen-commands.log.
I was interested in the tracking of bwa / fgbio / vardict, and easily found it from the log,
like ~50% time bwa, ~10% of the time fgbio, and ~1% vardict.
If you are not aiming to decipher the running time of every single little took, and just have a big picture of the resources, parsing the log helps.

Also, see https://bcbio-nextgen.readthedocs.io/en/latest/contents/parallel.html#profiling
to profile memory, CPU, and IO usage.

@naumenko-sa naumenko-sa mentioned this issue Jun 8, 2020
90 tasks
@rkendar
Copy link
Author

rkendar commented Jun 9, 2020

Thank you so much for all the information. I will take a look at that.
@amizeranschi Great! Thank you so much, definitely will give it a try.

Thanks all!

Sign up for free to join this conversation on GitHub. Already have an account? Sign in to comment
Projects
None yet
Development

No branches or pull requests

4 participants