The documentation is divided in four sections:
- Website documentation
- Web apps documentation
- Most common errors and warnings
- Using WI Fast Stats to learn to code
WI Fast Stats is an animated website which serves as a medium to a collection of R-developed web apps that provide Data Visualization and Data Analysis tools for WI Fast Plants data.
The main website consists of 6 sections:
The Home page is a collection of WI Fast Plants photos.

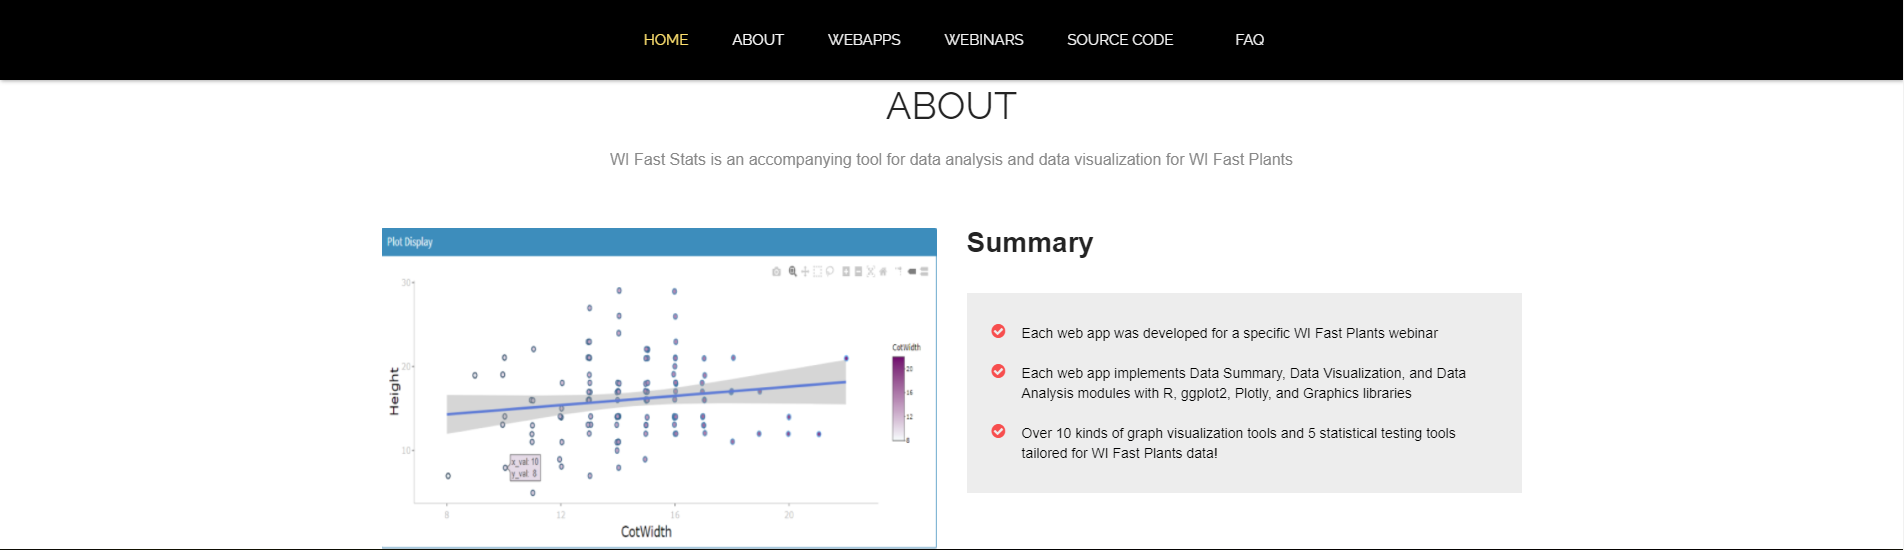
The About page shows the general information and features of the web apps.
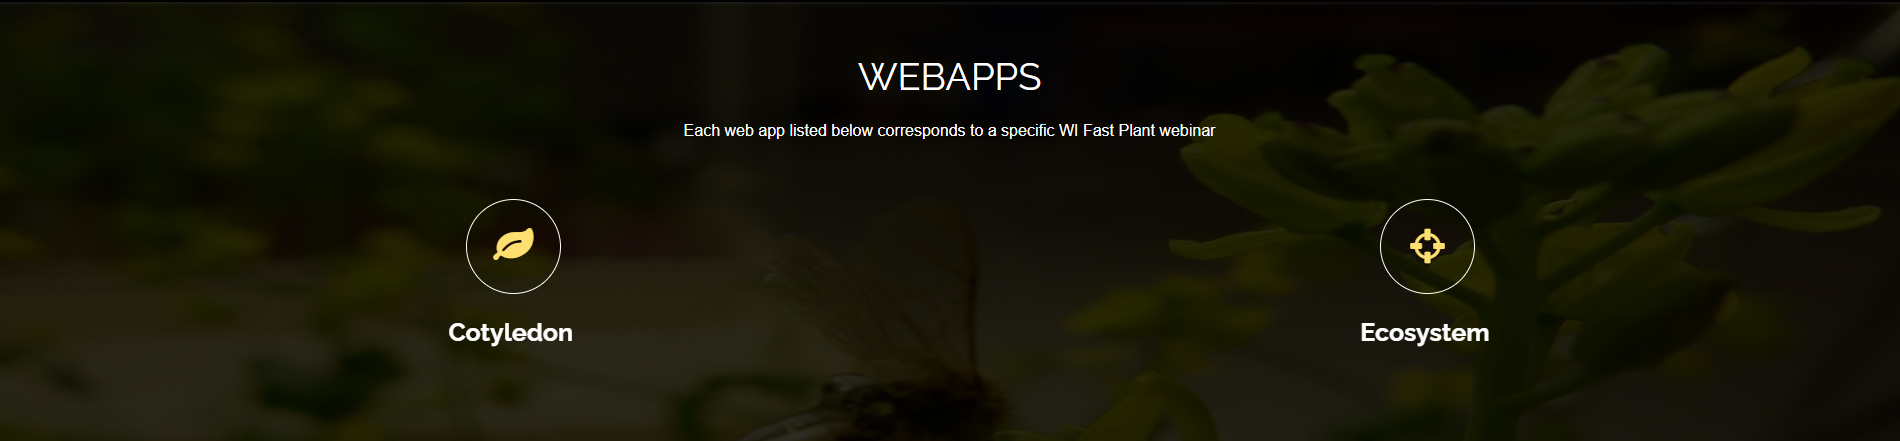
The Web Apps page lists all the web apps and their links.
The developers of WI Fast Stats work closely with WI Fast Plants to organize webinars that include biological concepts and statistical concepts.
The Webinars page displays a timeline for all the WI Fast Plant webinars held so far each corresponding to a web app listed above. More webinars will happen in the future and they will be added accordingly alongside their corresponding web app.

The Source Code page presents the link to the Github repository. By providing the source code, we hope that WI Fast Stats could also serve as a entry way into programming for some audiences. You can learn more in the Learning to Code section.

As intended, the FAQ section contains questions and answers related to web apps and webinars.

Launching the app brings up the Home tab. The Home tab is basically a landing page that gives a brief introduction to the app and includes relevant information for the corresponding webinars. The following figure shows the basic Home tab.
The web app consists of four main tabs:

Click Data Upload in the sidepanel to upload a data file. The dataset should be in csv format and it will be uploaded using the Data Upload box. Data should be numeric or categorical and should not contain any NULL/NaN/NA values. The file should be no larger than 10MB. Users are encouraged to read the paper on Data Organization in Spreadsheets.
WI Fast Stats web app comes with a sample dataset and in the examples below, we will use the "Sample dataset". The sample datasets are described on the web app, and we also describe them next:
- Cotyledon sample data: The sample data included here mimics the structure of a dataset the students will have after following the experiments described in the webinar. There are four columns: Plant ID, Cotyledons (number of cotyledons), Generation (parent or offspring), Parents (number of cotyledons each parent had). Each row corresponds to a plant, and we count the number of cotyledons. The generation column identifies if the plant is "parent" (p) or "offspring" (O). The parents column shows which were the parents of that plant. For example, 2x2 means that both parents had 2 cotyledons.
- Ecosystem sample data: The sample data included here mimics the structure of a dataset the students will have after following the experiments described in the webinar. There are six columns: Plant (plant ID), Treatment (light or dark treatment), Root length in mm, Shoot length in mm, Root to shoot ration and Total length. Each row corresponds to a plant. The treatment column refers to dark (D) or light (L) and we measure different lengths: root, shoot and total for each plant.

Select Data Visualization in the sidepanel in order to visualize the dataset.
Choose a graph from the Plot Type selector, which contains 5 types of plots for the cotyledon web app (plot options could vary depending on the web app):
- Mosaic Plot
- Violin Plot
- Box Plot
- Scatter Plot
- Density Plot
Choose the variables you want to compare with in the radio buttons. You must select the variables corresponding to the type specified above, e.g., group variables (categorical type) or quantity variables (numeric type); otherwise, the system will throw a warning message, indicating that the variable that you have selected is invalid. More on common errors and warnings in the section below.
There are also four interactive functions that provide flexibility to the plot:
- Color
- Point Shape
- Transparency
- Point Size
We provide up to 10 color palettes, 7 kinds of point shape, transparency scalar, and point size scalar in this application. The default settings are: Blue+Purple color palettes, circle point shape, 65% transparency, and point size 1. Try to use different combinations and parameters to visualize the outputs!
After everything is set, click on the button below and the plot will automatically be displayed in the Plot Display box. On the top right corner of the plot, there is a line of tools provided by Plotly which allow users to download the plot as .png format, zoom in/out the plot, perform Lasso Select, and use compare tooltip to fully interact with the plots.
More information on the some of the plots can be found in the webinar slides.

We provide 2 statistical tests in this section, namely:
- Chi-Square Test
- T-Test
Compared with the Data Visualization module, Data Analysis is more straightforward: all you need to do is to select the type of test and the corresponding variables for the test. The test result will be automatically displayed in the Results Displayed box.
The Data Analysis section also depends on the specific web app. For example, the ecosystem web app does not have a Data Analysis tab because this webinar is aimed at middle school students who have not studied statistical tests yet.
More information on the statistical tests can be found in the webinar slides.

Finally, click FAQ in the sidepanel to see more related information about this app and the webinars.

We list below the most common errors when running the web apps remotely (on the browser).
- The data is not in the right format: The errors are difficult to list in this case, but make sure that your dataset follows the same format as the sample dataset (described in the Data Upload section) and make sure that the dataset does not have any missing values. Users are encouraged to read the paper on Data Organization in Spreadsheets.
When running the web apps locally, you might see some warnings in the R console. Most warnings can be safely ignored (but feel free to create an issue in the GitHub issue tracker if you are unsure).
Some commonly prompted warnings are:
Warning: guides(<scale> = FALSE) is deprecated. Please use guides(<scale> = "none") instead: This warning can be ignored as it is not in our control. Our functions are not callingguidesdirectly, so we cannot make this change in our code.Warning: Groups with fewer than two data points have been dropped: This means that some categories in the selected "Group variable" only have one data points. For example, in the cotyledon data, we have the group variable ofGenerationwhich can be parent (P) or offspring (O). If there is only one plant in one of the categories (for example, parents), then you will get this warning. It is expected that group variables have at least two data points (plants).
If the error or warning that you get does not appear here, please check out what to do in the section below.
We believe in the power of open source code as an entry point for people everywhere to learn about programming.
In order to understand our code, you first need to learn about the following topics:
- R programming for beginners: 3-hour YouTube video with well-delimited chapters (no need to watch all 3 hours): What is R, Feature of R, How to setup R, Variables in R, Data Types in R, Logical Operators, Print Formatting, R objects, Lists, Matrices, Data Frames and if/for/while statements.
- R shiny apps tutorial: 9 introductory videos on what are shiny apps and how to build one.
After learning the necessary background, you can look at the source code hosted in the fast-stats github repository. The code for each web app can be found in the shiny-app folder. For example, for the webinar-aug20 folder (corresponding to the cotyledon web app), we can see that the web app code consists of two main files:
server.R: this file contains all the code to upload the data, create the plots and do the statistical analyses- Our plots are built using ggplot2
ui.R: this file contains the code for the user interface (the sidebar menu, the buttons and options provided for the user, color of the web app screen)
- Join the Google user group for general questions about the WI Fast Stats website and web apps
- Issues reports (strange errors or warnings) are encouraged through the GitHub issue tracker
- Feedback is always welcome via the following google form