Skip to content
New issue

Have a question about this project? Sign up for a free GitHub account to open an issue and contact its maintainers and the community.

By clicking “Sign up for GitHub”, you agree to our terms of service and privacy statement. We’ll occasionally send you account related emails.

Already on GitHub? Sign in to your account

4 axis graphs #4943

Closed
Tracked by #179199
markwalkom opened this issue Sep 15, 2015 · 3 comments
Closed
Tracked by #179199

4 axis graphs #4943

markwalkom opened this issue Sep 15, 2015 · 3 comments
Labels
Feature:New Vis Request for a new visualization type impact:needs-assessment Product and/or Engineering needs to evaluate the impact of the change. release_note:enhancement Team:Visualizations Visualization editors, elastic-charts and infrastructure

Comments

@markwalkom
Copy link
Contributor

I really dunno what these are actually called, but it'd be great to see.

Imagine a graph with 4 axis, at 0, -90, 180 and 90 degrees. Then we could build something like this but better -

@rashidkpc
Copy link
Contributor

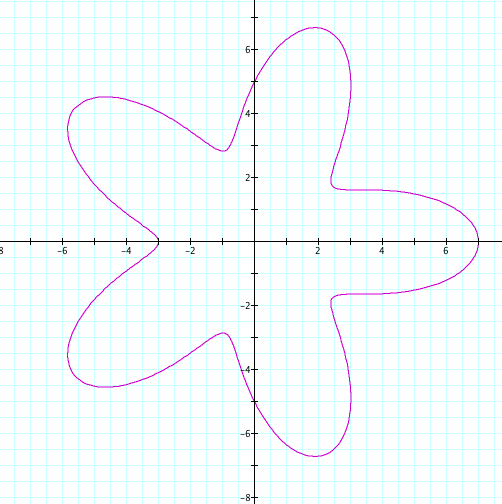
What is this sort of chart used for and what meaning does the shape have? The data shown here is not a function, even within the quandrants themselves. What meaning would a user derive from this specific example?

Can you attach an elasticsearch aggregation that would produce data usable in this scenario?

@markwalkom
Copy link
Contributor Author

That was just a pic to give you an idea as I didn't know what to call it.

Specifically I am working on a data set that contains a direction and a value, think wind or travel speed. I thought it'd be neat if we could grab that degree and then the value of the speed and then build something like the above.

@epixa epixa added Feature:Visualizations Generic visualization features (in case no more specific feature label is available) and removed P4 labels Apr 25, 2017
@timroes timroes added the Feature:New Vis Request for a new visualization type label May 3, 2018
@timroes timroes added the Team:Visualizations Visualization editors, elastic-charts and infrastructure label Sep 16, 2018
@timroes timroes removed Feature:Visualizations Generic visualization features (in case no more specific feature label is available) labels Oct 1, 2018
@stratoula stratoula added the impact:needs-assessment Product and/or Engineering needs to evaluate the impact of the change. label May 26, 2023
@timductive
Copy link
Member

Closing this because it's not planned to be resolved in the foreseeable future. It will be tracked in our Icebox and will be re-opened if our priorities change. Feel free to re-open if you think it should be melted sooner.

@timductive timductive closed this as not planned Won't fix, can't repro, duplicate, stale Mar 21, 2024
Sign up for free to join this conversation on GitHub. Already have an account? Sign in to comment
Labels
Feature:New Vis Request for a new visualization type impact:needs-assessment Product and/or Engineering needs to evaluate the impact of the change. release_note:enhancement Team:Visualizations Visualization editors, elastic-charts and infrastructure
Projects
None yet
Development

No branches or pull requests

6 participants