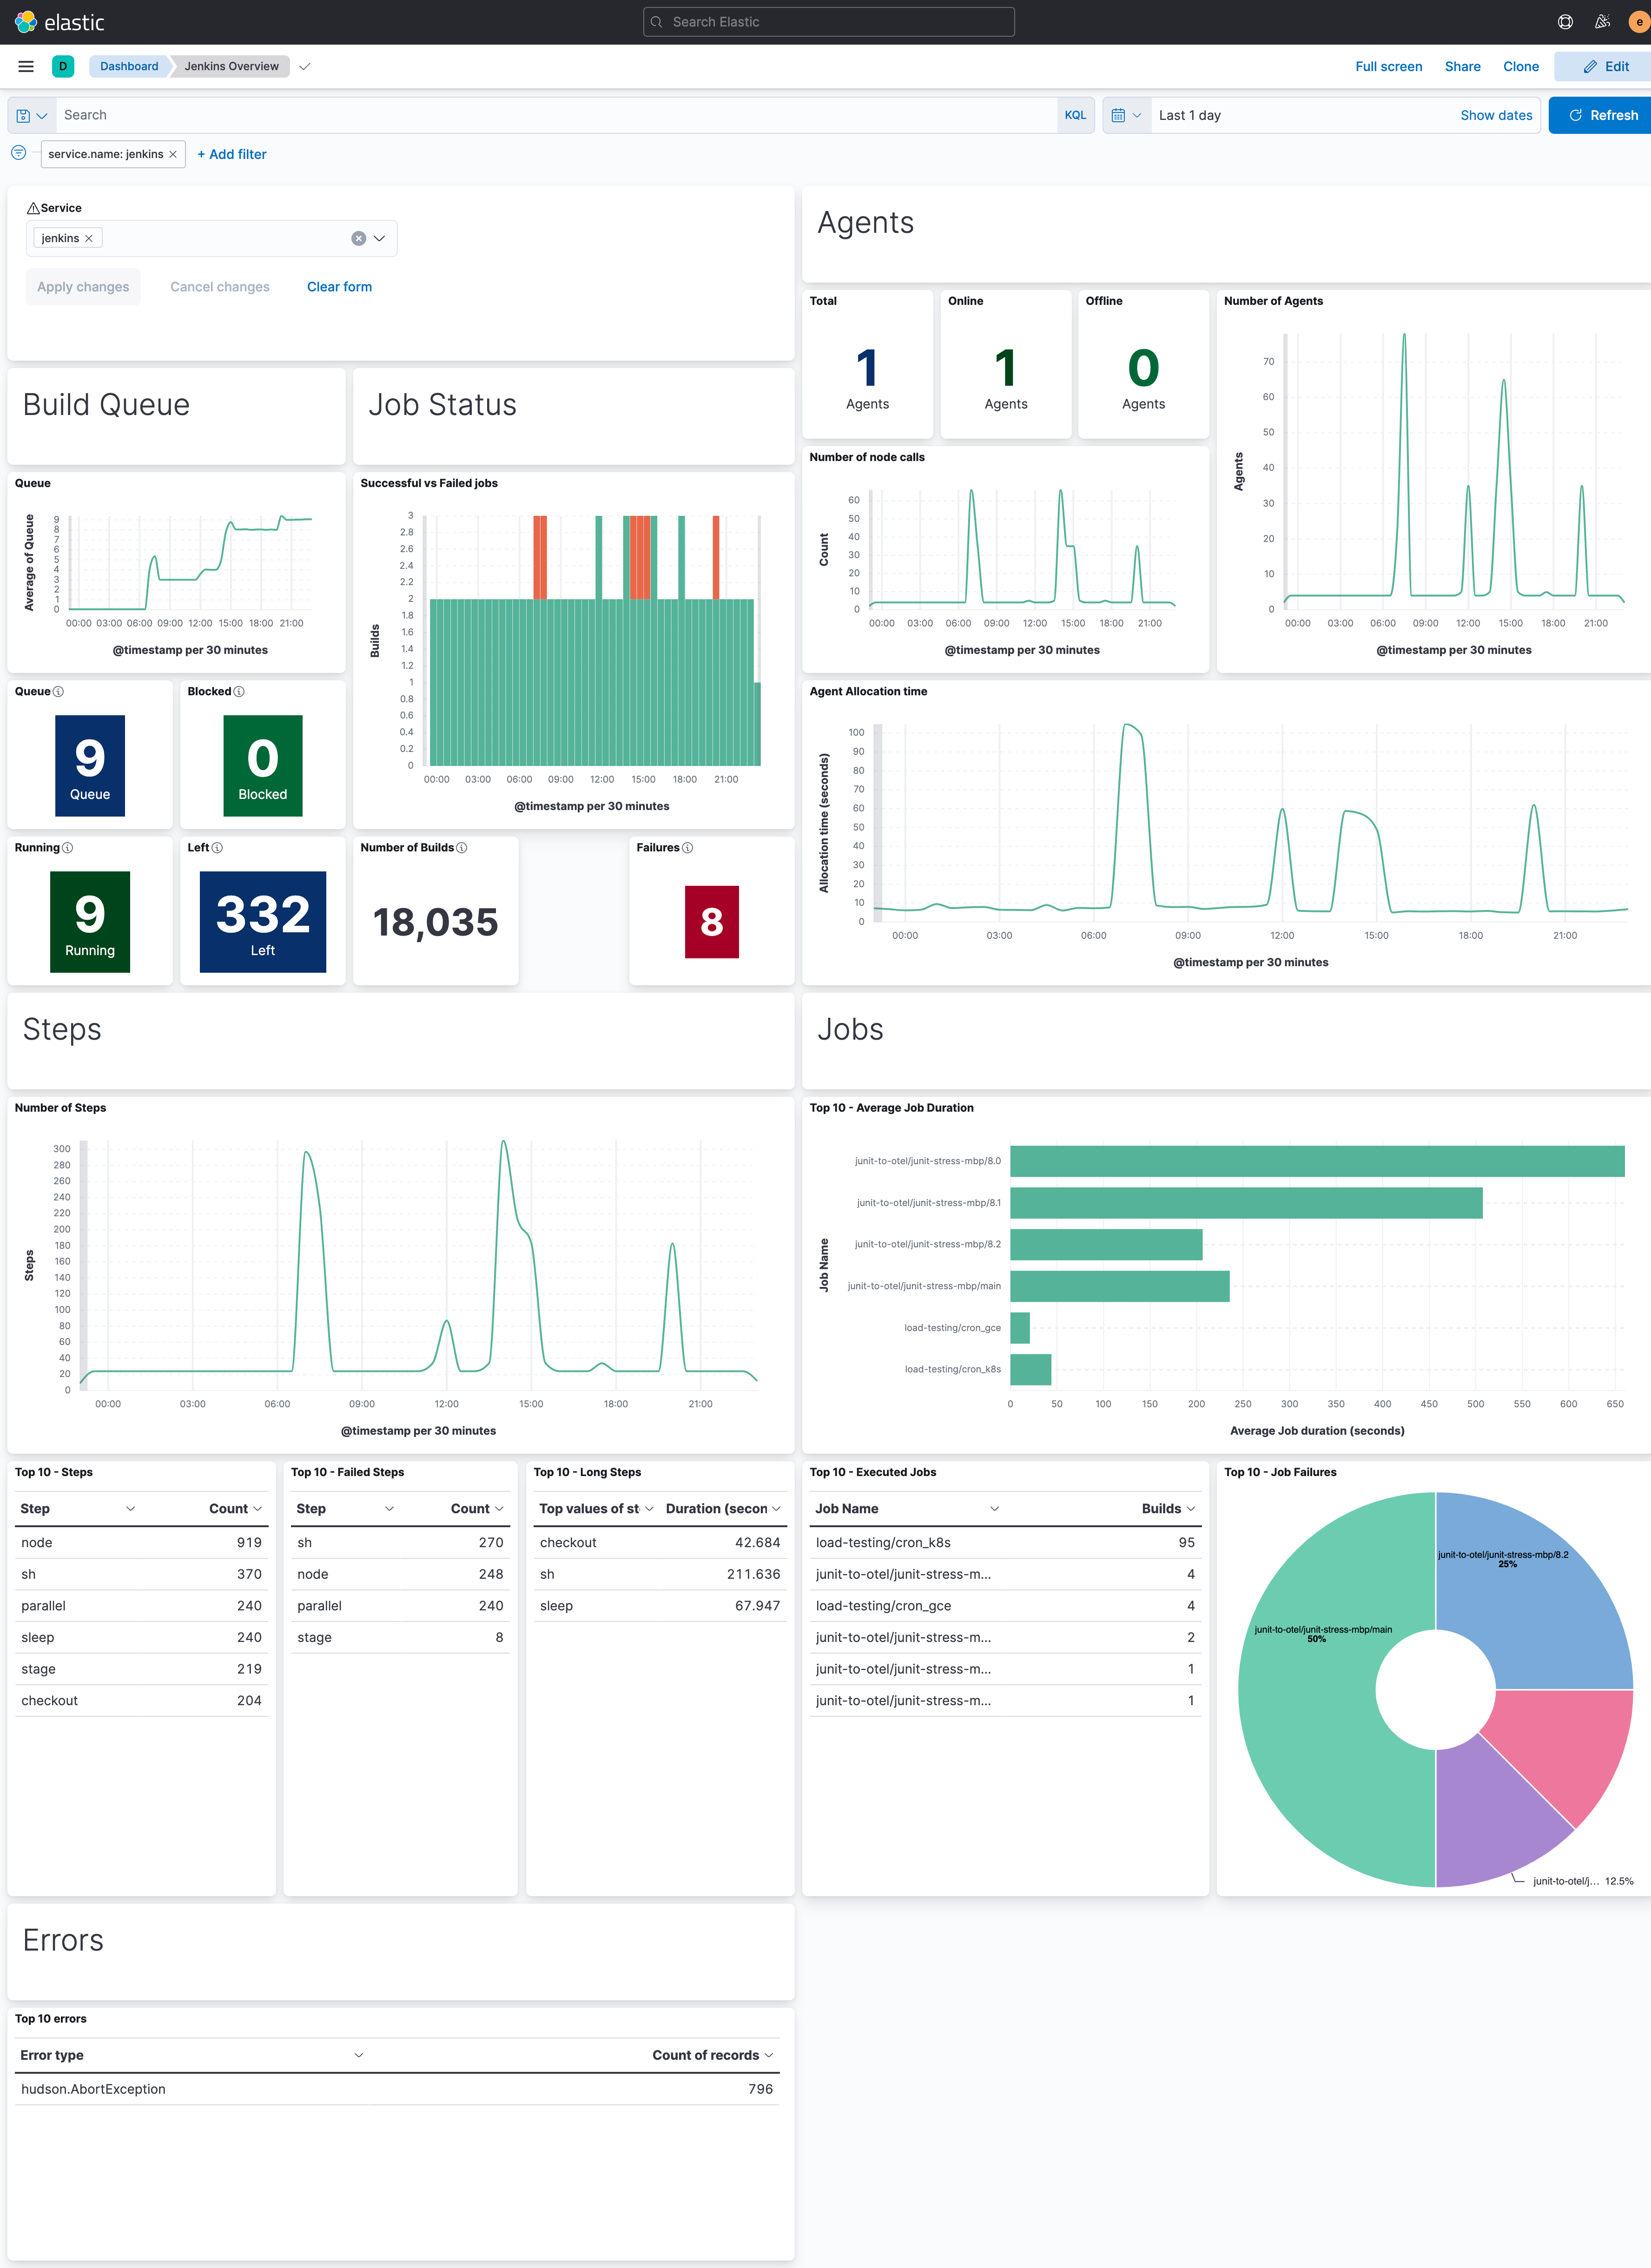
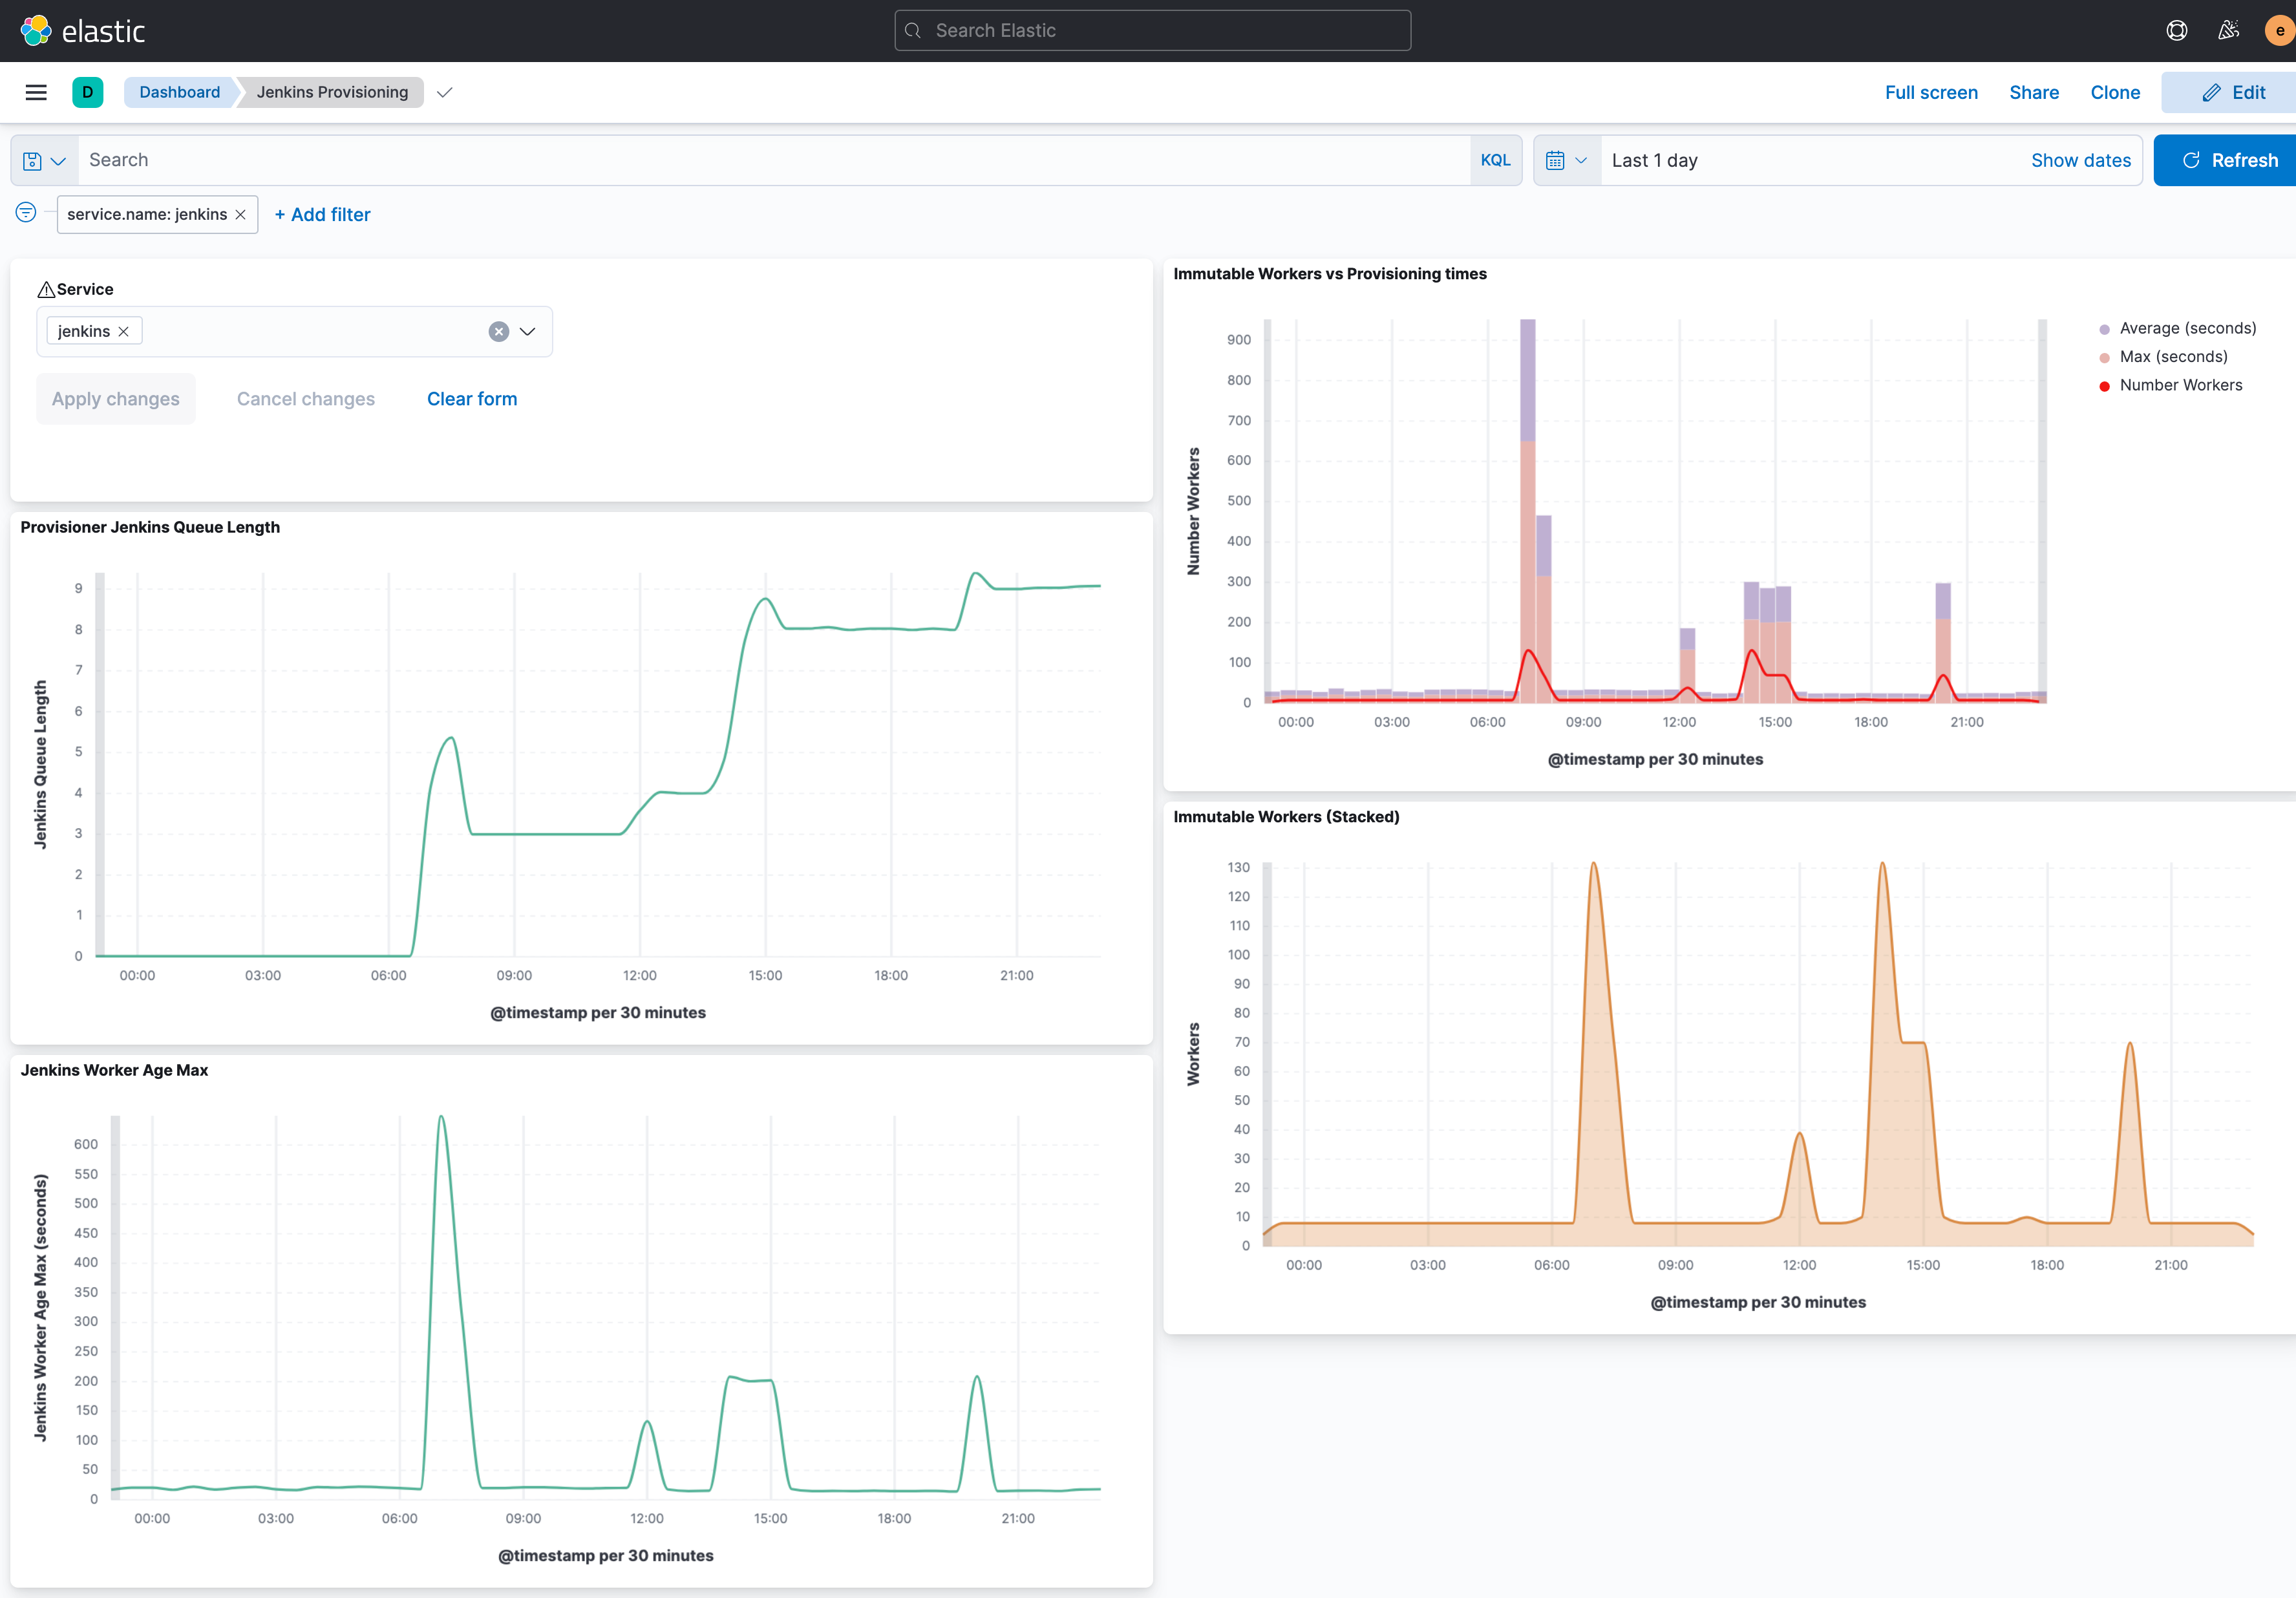
Jenkins' metrics can be visualised with any OpenTelemetry compatible metrics solution such as Prometheus or Elastic Observability
The Jenkins OpenTelemetry integration provides all the key health metrics to monitor Jenkins with dashboards and alerts.
 Example Kibana dashboard of the Jenkins and CI jobs health
Monitor Jenkins with Elastic Observability importing the dashboard definitions jenkins-kibana-dashboards.ndjson in Kibana (v7.12+).
Dashboards can be imported in Kibana using the Kibana GUI (here) or APIs (here).
| Jenkins and CI jobs health | Jenkins Agent provisioning health |
|---|---|
 |
 |
ci.pipeline.run.duration metrics are enabled by default
aggregating the durations of all the jobs/pipelines under the umbrella ci.pipeline.id=#other#.
To enable per job/pipeline metrics, use the allow and deny list setting the configuration parameters
otel.instrumentation.jenkins.run.metric.duration.allow_list and otel.instrumentation.jenkins.run.metric.duration.deny_list.
- Name:
ci.pipeline.run.duration - Type: Histogram with buckets:
1, 2, 4, 8, 16, 32, 64, 128, 256, 512, 1024, 2048, 4096, 8192(buckets subject to change) - Unit:
s - Attributes:
ci.pipeline.id: The full name of the Jenkins job if complying with the allow and deny lists specified through configuration parameters documented below, otherwise#other#to limit the cardinality of the metric. Example:my-team/my-app/main. Seehudson.model.AbstractItem#getFullName().ci.pipeline.result:SUCCESS,UNSTABLE,FAILUIRE,NOT_BUILT,ABORTED. Seehudson.model.Run#getResult().
- Configuration parameters to control the cardinality of the
ci.pipeline.idattribute:otel.instrumentation.jenkins.run.metric.duration.allow_list: Java regex, default value:$^(ie impossible regex matching nothing). Examplejenkins_folder_a/.*|jenkins_folder_b/.*otel.instrumentation.jenkins.run.metric.duration.deny_list: Java regex, default value:$^(ie impossible regex matching nothing). Example.*test.*
Inventory of health metrics collected by the Jenkins OpenTelemetry integration:
| Metric | Unit | Attribute Key | Attribute value | Description |
|---|---|---|---|---|
| ci.pipeline.run.duration | s |
Duration of runs | ||
| ci.pipeline.run.active | {jobs} |
Gauge of active jobs | ||
| ci.pipeline.run.active | {jobs} |
Gauge of active jobs | ||
| ci.pipeline.run.launched | {jobs} |
Job launched | ||
| ci.pipeline.run.started | {jobs} |
Job started | ||
| ci.pipeline.run.completed | {jobs} |
Job completed | ||
| ci.pipeline.run.aborted | {jobs} |
Job aborted | ||
| ci.pipeline.run.success | {jobs} |
Job successful | ||
| ci.pipeline.run.failed | {jobs} |
Job failed | ||
| jenkins.executor | ${executors} |
label,status
|
Jenkins build agent labelcode> like linuxbusy, idle, connecting
|
Jenkins executors broken down by label and status. Executors annotated with
multiple label are reported multiple times
|
| jenkins.executor.total | ${executors} |
status
|
busy, idle
|
Jenkins executors broken down by status |
| jenkins.node | ${nodes} |
status
|
online, offline
|
Jenkins build nodes |
| jenkins.executor.available | ${executors} |
label |
||
| jenkins.executor.busy | ${executors} |
label |
||
| jenkins.executor.idle | ${executors} |
label |
||
| jenkins.executor.online | ${executors} |
label |
||
| jenkins.executor.connecting | ${executors} |
label |
||
| jenkins.executor.defined | ${executors} |
label |
||
| jenkins.executor.queue | ${items} |
label |
||
| jenkins.queue | ${tasks} |
status |
blocked, buildable, stuck, waiting, unknown
|
Number of tasks in the queue. See statuscode> description [here](https://javadoc.jenkins.io/hudson/model/Queue.html) |
| jenkins.queue.waiting | ${items} |
Number of tasks in the queue with the status 'buildable' or 'pending' (see Queue#getUnblockedItems()) |
||
| jenkins.queue.blocked | ${items} |
Number of blocked tasks in the queue. Note that waiting for an executor to be available is not a reason to be counted as blocked. (see QueueListener#onEnterBlocked() - QueueListener#onLeaveBlocked()) |
||
| jenkins.queue.buildable | ${items} |
Number of tasks in the queue with the status 'buildable' or 'pending' (see Queue#getBuildableItems()) |
||
| jenkins.queue.left | ${items} |
Total count of tasks that have been processed (see [`QueueListener#onLeft`]()- | ||
| jenkins.queue.time_spent_millis | ms |
Total time spent in queue by the tasks that have been processed (see QueueListener#onLeft() and Item#getInQueueSince()) |
||
| jenkins.disk.usage.bytes | By |
Disk Usage size | ||
| http.server.request.duration | s |
http.request.method,url.scheme,error.type, http.response.status_code, http.route, server.address, server.port
|
HTTP server duration metric as defined by the OpenTelemetry specification ([here](https://opentelemetry.io/docs/specs/semconv/http/http-metrics/#metric-httpserverrequestduration)) | |
| jenkins.plugins | ${plugins} |
status |
active, inactive, failed |
Jenkins plugins broken down by activation status |
| jenkins.plugins.updates | ${plugins} |
status |
hasUpdate, isUpToDate |
Jenkins plugins broken down by updatability status |
| Metric | Unit | Attribute Key | Attribute value | Description |
|---|---|---|---|---|
| jenkins.agents.total | {agents} |
Number of agents | ||
| jenkins.agents.online | {agents} |
Number of online agents | ||
| jenkins.agents.offline | {agents} |
Number of offline agents | ||
| jenkins.agents.launch.failure | {agents} |
Number of failed launched agents | ||
| jenkins.cloud.agents.completed | {agents} |
Number of provisioned cloud agents | ||
| jenkins.cloud.agents.launch.failure | {agents} |
Number of failed cloud agents |
| Metric | Unit | Attribute Key | Attribute value | Description |
|---|---|---|---|---|
| github.api.rate_limit.remaining_requests | {requests} |
Always reported: github.api.url, github.authenticationFor user based authentication: enduser.idFor GitHub App based authentication: github.app.id, github.app.owner,
github.app.name
|
Examples:
|
When using the GitHub Branch Source plugin, remaining requests for the authenticated GitHub user/app according to the GitHub API Rate Limit |
| jenkins.scm.event.pool_size | {events} |
Thread pool size of the SCM Event queue processor | ||
| jenkins.scm.event.active_threads | {threads} |
Number of active threads of the SCM events thread pool | ||
| jenkins.scm.event.queued_tasks | {tasks} |
Number of events in the SCM event queue | ||
| jenkins.scm.event.completed_tasks | {tasks} |
Number of processed SCM events |
See OpenTelemetry Semantic Conventions for Runtime Environment Metrics.
| Metric | Description | Type | Attribute Key | Attribute value |
|---|---|---|---|---|
| process.runtime.jvm.buffer.count | The number of buffers in the pool | gauge | pool | direct, mapped, mapped - 'non-volatile memory' |
| process.runtime.jvm.buffer.limit | Total capacity of the buffers in this pool | gauge | pool | direct, mapped, mapped - 'non-volatile memory' |
| process.runtime.jvm.buffer.usage | Memory that the Java virtual machine is using for this buffer pool | gauge | pool | direct, mapped, mapped - 'non-volatile memory' |
| process.runtime.jvm.classes.current_loaded | Number of classes currently loaded | gauge | ||
| process.runtime.jvm.classes.loaded | Number of classes loaded since JVM start | counter | ||
| process.runtime.jvm.classes.unloaded | Number of classes unloaded since JVM start | counter | ||
| process.runtime.jvm.cpu.utilization | Recent cpu utilization for the process | gauge | ||
| process.runtime.jvm.gc.duration | Duration of JVM garbage collection actions | histogram | action gc |
end of minor GC... G1 Young Generation... |
| process.runtime.jvm.memory.committed | Measure of memory committed | gauge | pool type |
CodeHeap 'non-nmethods', CodeHeap 'non-profiled nmethods', CodeHeap
'profiled nmethods', Compressed Class Space, G1 Eden Space, G1..., Metaspace heap, non_heap |
| process.runtime.jvm.memory.init | Measure of initial memory requested | gauge | pool type |
CodeHeap 'non-nmethods', CodeHeap 'non-profiled nmethods', CodeHeap
'profiled nmethods', Compressed Class Space, G1 Eden Space, G1..., Metaspace heap, non_heap |
| process.runtime.jvm.memory.limit | Measure of max obtainable memory | gauge | pool type |
CodeHeap 'non-nmethods', CodeHeap 'non-profiled nmethods', CodeHeap
'profiled nmethods', Compressed Class Space, G1 Eden Space, G1..., Metaspace heap, non_heap |
| process.runtime.jvm.memory.usage | Measure of memory used | gauge | pool type |
CodeHeap 'non-nmethods', CodeHeap 'non-profiled nmethods', CodeHeap
'profiled nmethods', Compressed Class Space, G1 Eden Space, G1..., Metaspace heap, non_heap |
| process.runtime.jvm.memory.usage_after_last_gc | Measure of memory used after the most recent garbage collection event on this pool | gauge | pool type |
CodeHeap 'non-nmethods', CodeHeap 'G1 Eden Space, G1 Old Gen, G1 Survivor
Space heap, non_heap |
| process.runtime.jvm.system.cpu.load_1m | Average CPU load of the whole system for the last minute | gauge | ||
| process.runtime.jvm.system.cpu.utilization | Recent cpu utilization for the whole system | gauge | ||
| process.runtime.jvm.cpu.utilization | Recent cpu utilization for the process | gauge | ||
| process.runtime.jvm.threads.count | Number of executing threads | gauge | daemon | true, false |
| Metrics | Unit | Attribute Key | Attribute value | Description |
|---|---|---|---|---|
| login | ${logins} | Login count | ||
| login_success | ${logins} | Successful login count | ||
| login_failure | ${logins} | Failed login count |