Skip to content
New issue

Have a question about this project? Sign up for a free GitHub account to open an issue and contact its maintainers and the community.

By clicking “Sign up for GitHub”, you agree to our terms of service and privacy statement. We’ll occasionally send you account related emails.

Already on GitHub? Sign in to your account

pwa-chrome launch and attach doesn't hit break points #271

Closed
alexr00 opened this issue Jan 28, 2020 · 20 comments
Closed

pwa-chrome launch and attach doesn't hit break points #271

alexr00 opened this issue Jan 28, 2020 · 20 comments
Assignees
Labels
bug Issue identified by VS Code Team member as probable bug verified Verification succeeded
Milestone

Comments

@alexr00
Copy link
Member

alexr00 commented Jan 28, 2020

Testing microsoft/vscode#89393 on Windows

  • Add the pwa- prefix to the Launch VS Code debug configuration in the vscode project.
  • Set a breakpoint (You can do this before or after running the configuration)
  • Run that launch config
    Expected: The break point resolves and is hit when the code path is run.
    Actual: I can't get any breakpoints to resolve so none are hit.

I tried commenting out the "Settings for js-debug" that are in that launch config, and it made no difference.

@alexr00
Copy link
Member Author

alexr00 commented Jan 28, 2020

Same issue with attach.

@alexr00 alexr00 changed the title pwa-chrome launch doesn't hit break points pwa-chrome launch and attach doesn't hit break points Jan 28, 2020
@alexr00 alexr00 transferred this issue from microsoft/vscode Jan 28, 2020
@chrmarti
Copy link

I can debug as usual when launching, but not when attaching to Chrome. (On Mac.)

When attached the breakpoints don't register (neither in TS nor in JS):
image

@connor4312
Copy link
Member

@alexr00 can you enable trace: true and share your logs files?

@chrmarti in your screenshot, I don't see any sessions in the Call Stack view. This indicates that we couldn't find a target to attach to, most likely because we don't have a page matching the url pattern in your launch config. In my tour of heroes config I have "url": "http://localhost:4200/*",. Do you have something different in yours / did the config you have work for the existing debugger?

@chrmarti
Copy link

Putting the exact URL there ("http://localhost:3000/dashboard") shows the same behavior. Using something else shows an error dialog:
image

@alexr00
Copy link
Member Author

alexr00 commented Jan 29, 2020

renderer1.log

exthost.log

@connor4312 connor4312 added this to the February 2020 milestone Feb 3, 2020
@connor4312
Copy link
Member

Sorry, I should have specified more about what logs I was after!

When you enable trace: true, the debug console on the debugging process will print a file where logs are written. It'll look something like this--that's the file I'm after:

image

@alexr00
Copy link
Member Author

alexr00 commented Feb 4, 2020

vscode-debugadapter.txt

@connor4312
Copy link
Member

connor4312 commented Feb 5, 2020

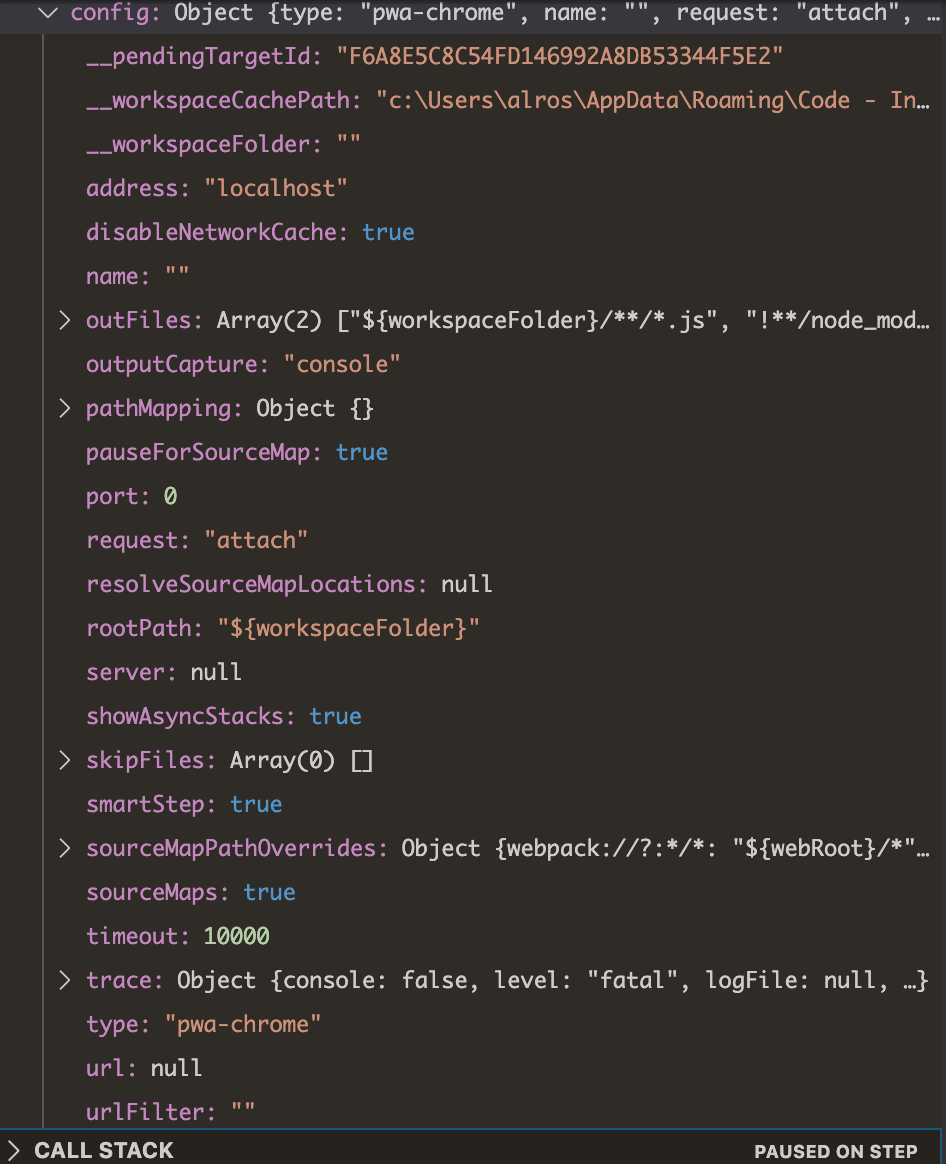
@isidorn @weinand Alex and I debugged this over Live Share this morning (debugging over live share is super cool, by the way!) and it seemed like it might be some VS Code related thing.

Here's what happens. Like all sessions in js-debug, there's the top level "wrapper" sessions, and then debugees come in as children. The top level session works fine and it creates a session which is loopbacked to VS Code1. The __pendingTargetId is what we use to reference the target we're holding onto to 'inject' into the new session.

I see this go through the Chrome config provider, which doesn't do much except for apply defaults that we actually don't really care about for delegate sessions. This is the config that gets returned. No errors get thrown as far as I can see. And then, nothing happens. The SessionManager (which is the registered debug descriptor factory) doesn't get a request, the attachment process just stops.

As with all the best bugs, I can't reproduce this on my Windows or OSX machines. Any ideas on what might be happening?

@isidorn
Copy link

isidorn commented Feb 5, 2020

So the gist is:
Breakpoints do not get sent to child session? Or none of the requests get sent to the child session?

@alexr00 Does it reproduce if you manually click on the child session in the callstack view?

@connor4312 connor4312 added the under-discussion Issue is under discussion for relevance, priority, approach label Feb 5, 2020
@weinand
Copy link

weinand commented Feb 5, 2020

@connor4312 if I interpret your last comment correctly you are saying that no child session is created?
If that is correct: are you calling vscode.debug.startDebugging() for a child session which does not result in a call to the createDebugAdapterDescriptor method of your debug descriptor factory?

@connor4312
Copy link
Member

@weinand that's correct, the issue is that the child session is never actually created.

@weinand
Copy link

weinand commented Feb 5, 2020

@connor4312 @isidorn so we only need to debug why "startDebugging" fails to call the factory.

@connor4312 have you tried that?

@connor4312
Copy link
Member

If that is correct: are you calling vscode.debug.startDebugging() for a child session which does not result in a call to the createDebugAdapterDescriptor method of your debug descriptor factory?

Yes. I can verify:

  1. startDebugging is called
  2. we return a config (screenshotted above)
  3. createDebugAdapterDescriptor on the sessionManager (registered for that debug type) is not called

@alexr00
Copy link
Member Author

alexr00 commented Feb 6, 2020

@isidorn there's nothing in the callstack to click on.

@weinand
Copy link

weinand commented Feb 6, 2020

@alexr00 yes, there is no debug session at all, so the issue is completely unrelated to breakpoints.

@connor4312
Copy link
Member

connor4312 commented Feb 21, 2020

I'm seeing this happening very reliably in remote debugging (#337) iff I start the server before I start the debug session--which allows the page to load instantly (without the server, the remote debugging process launches chrome which then loads until the server starts). Seems like a race condition. Adding a bunch of console.logs (since debugging it changes timing and makes it work 😛 ):

image

  1. The top level session's config is resolved. All normal.
  2. We get a call to createDebugAdapterDescriptor as expected. Still all good. We create our debug adapter and then call the companion to launch the browser on the UI side.
  3. We're now attached to the browser and see there's a new page we can attach to! We call vscode.debug.startDebugging with that __pendingTargetId that we want to attach to.
  4. This loops back through the standard config resolution process.
  5. And then nothing happens--the debug adapter descriptor factory doesn't get any calls.

If I wrap the startDebugging call in a one second setTimeout, it works quite reliably.

@isidorn
Copy link

isidorn commented Feb 25, 2020

@connor4312 we could do a meeting to look into this issue together. If you would like that feel free to book something in my calendar.

@isidorn
Copy link

isidorn commented Mar 4, 2020

Should be fixed via microsoft/vscode#91969
If this is not the case let me know and we can reopen the vscode issue and continue the discussion there.

Thanks all for providing details.

@connor4312 connor4312 added bug Issue identified by VS Code Team member as probable bug verified Verification succeeded and removed under-discussion Issue is under discussion for relevance, priority, approach labels Mar 10, 2020
@alexr00
Copy link
Member Author

alexr00 commented Mar 11, 2020

Confirmed that this is fixed :)

@isidorn
Copy link

isidorn commented Mar 11, 2020

@alexr00 thanks a lot!

Sign up for free to join this conversation on GitHub. Already have an account? Sign in to comment
Labels
bug Issue identified by VS Code Team member as probable bug verified Verification succeeded
Projects
None yet
Development

No branches or pull requests

5 participants