(The Dashboard Tutorial on YouTube)
🔵 During test failures, logs and screenshots from the most recent test run will get saved to the latest_logs/ folder. If --archive-logs is specified (or if ARCHIVE_EXISTING_LOGS is set to True in settings.py), test logs will also get archived to the archived_logs/ folder. Otherwise, the log files will be cleaned out when the next test run begins (by default).
pytest test_fail.py(Log files in SeleniumBase/examples/example_logs were generated when test_fail.py ran and failed.)
Examples of expected log files generated during failures:
In addition to log files, you can also generate dashboards and test reports.
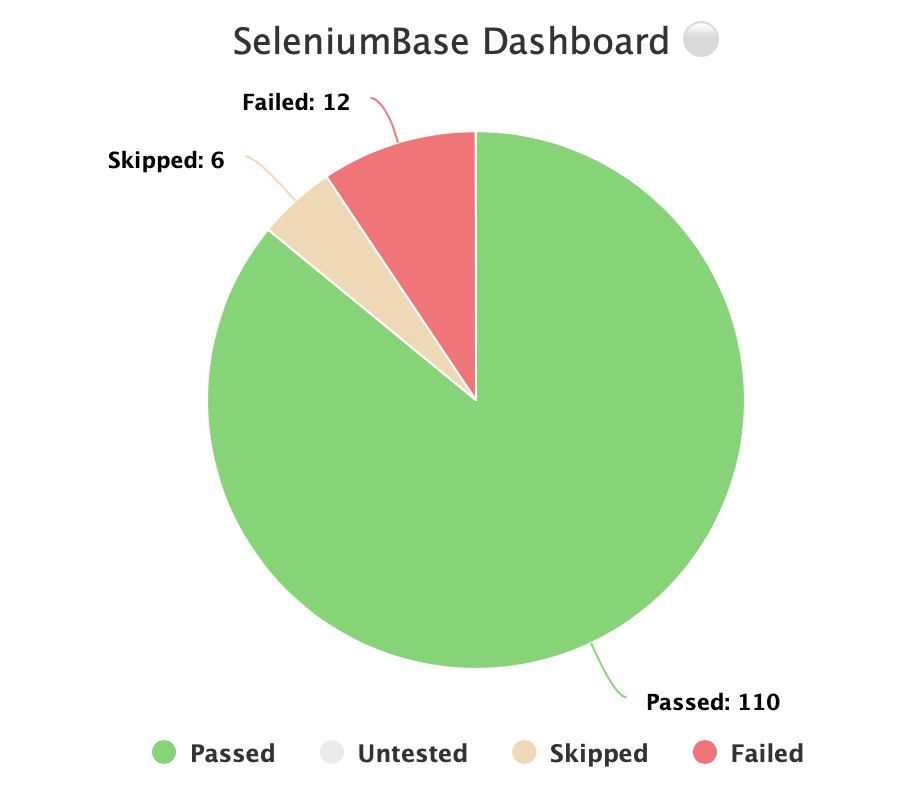
🔵 The --dashboard option for pytest generates a SeleniumBase Dashboard located at dashboard.html, which updates automatically as tests run and produce results. Example:
pytest --dashboard --rs --headless🔵 Additionally, you can host your own SeleniumBase Dashboard Server on a port of your choice. Here's an example of that using Python 3's http.server:
python -m http.server 1948🔵 Now you can navigate to http://localhost:1948/dashboard.html in order to view the dashboard as a web app. This requires two different terminal windows: one for running the server, and another for running the tests, which should be run from the same directory. (Use Ctrl+C to stop the http server.)
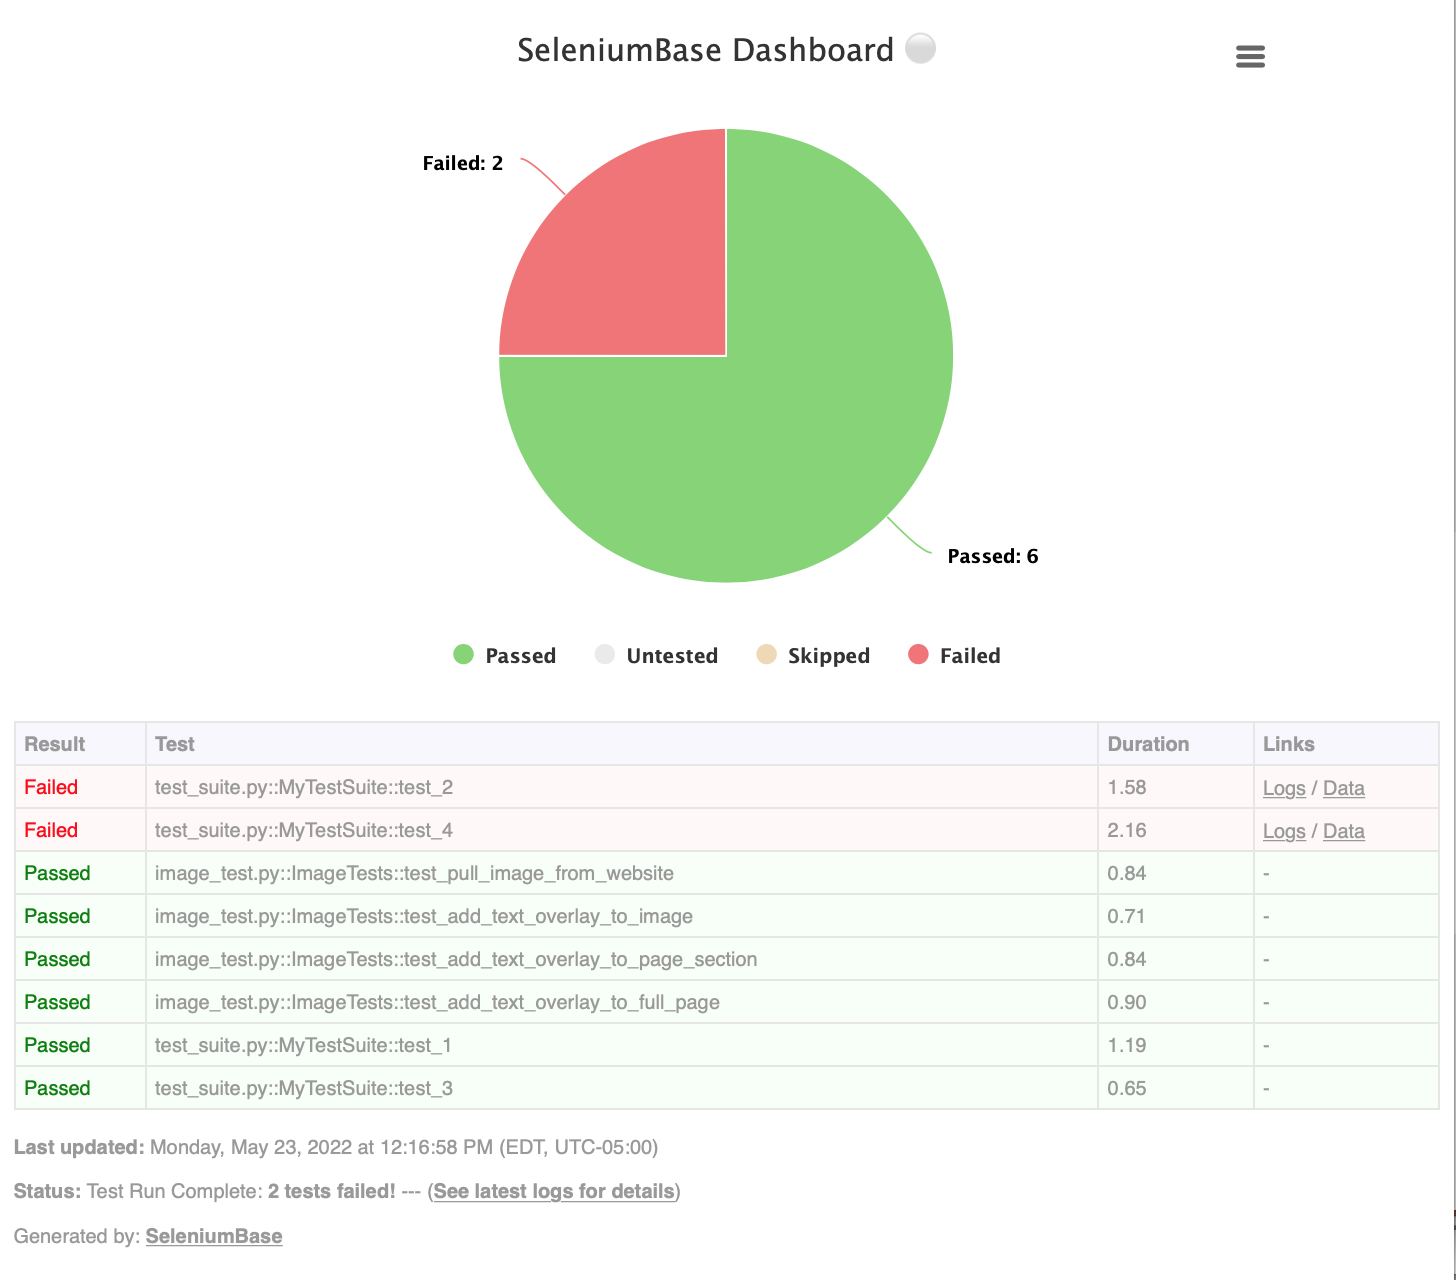
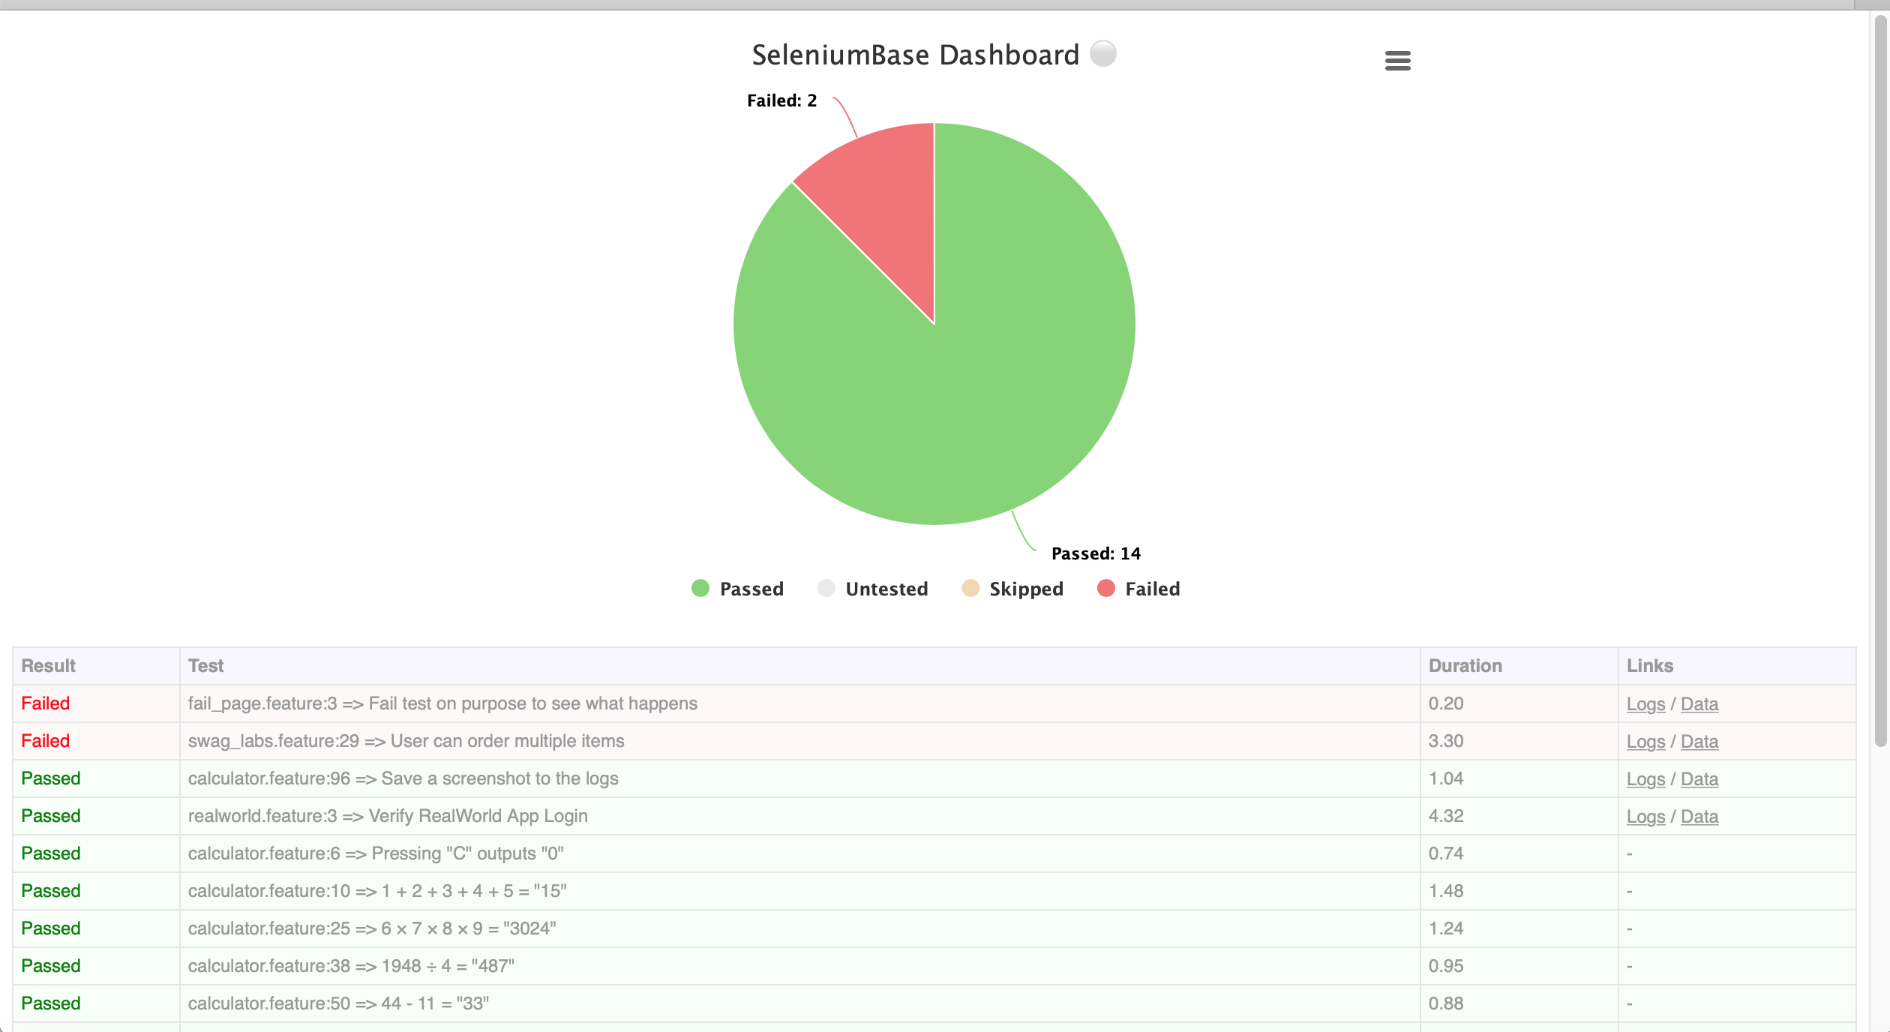
🔵 Here's a full example of what the SeleniumBase Dashboard may look like:
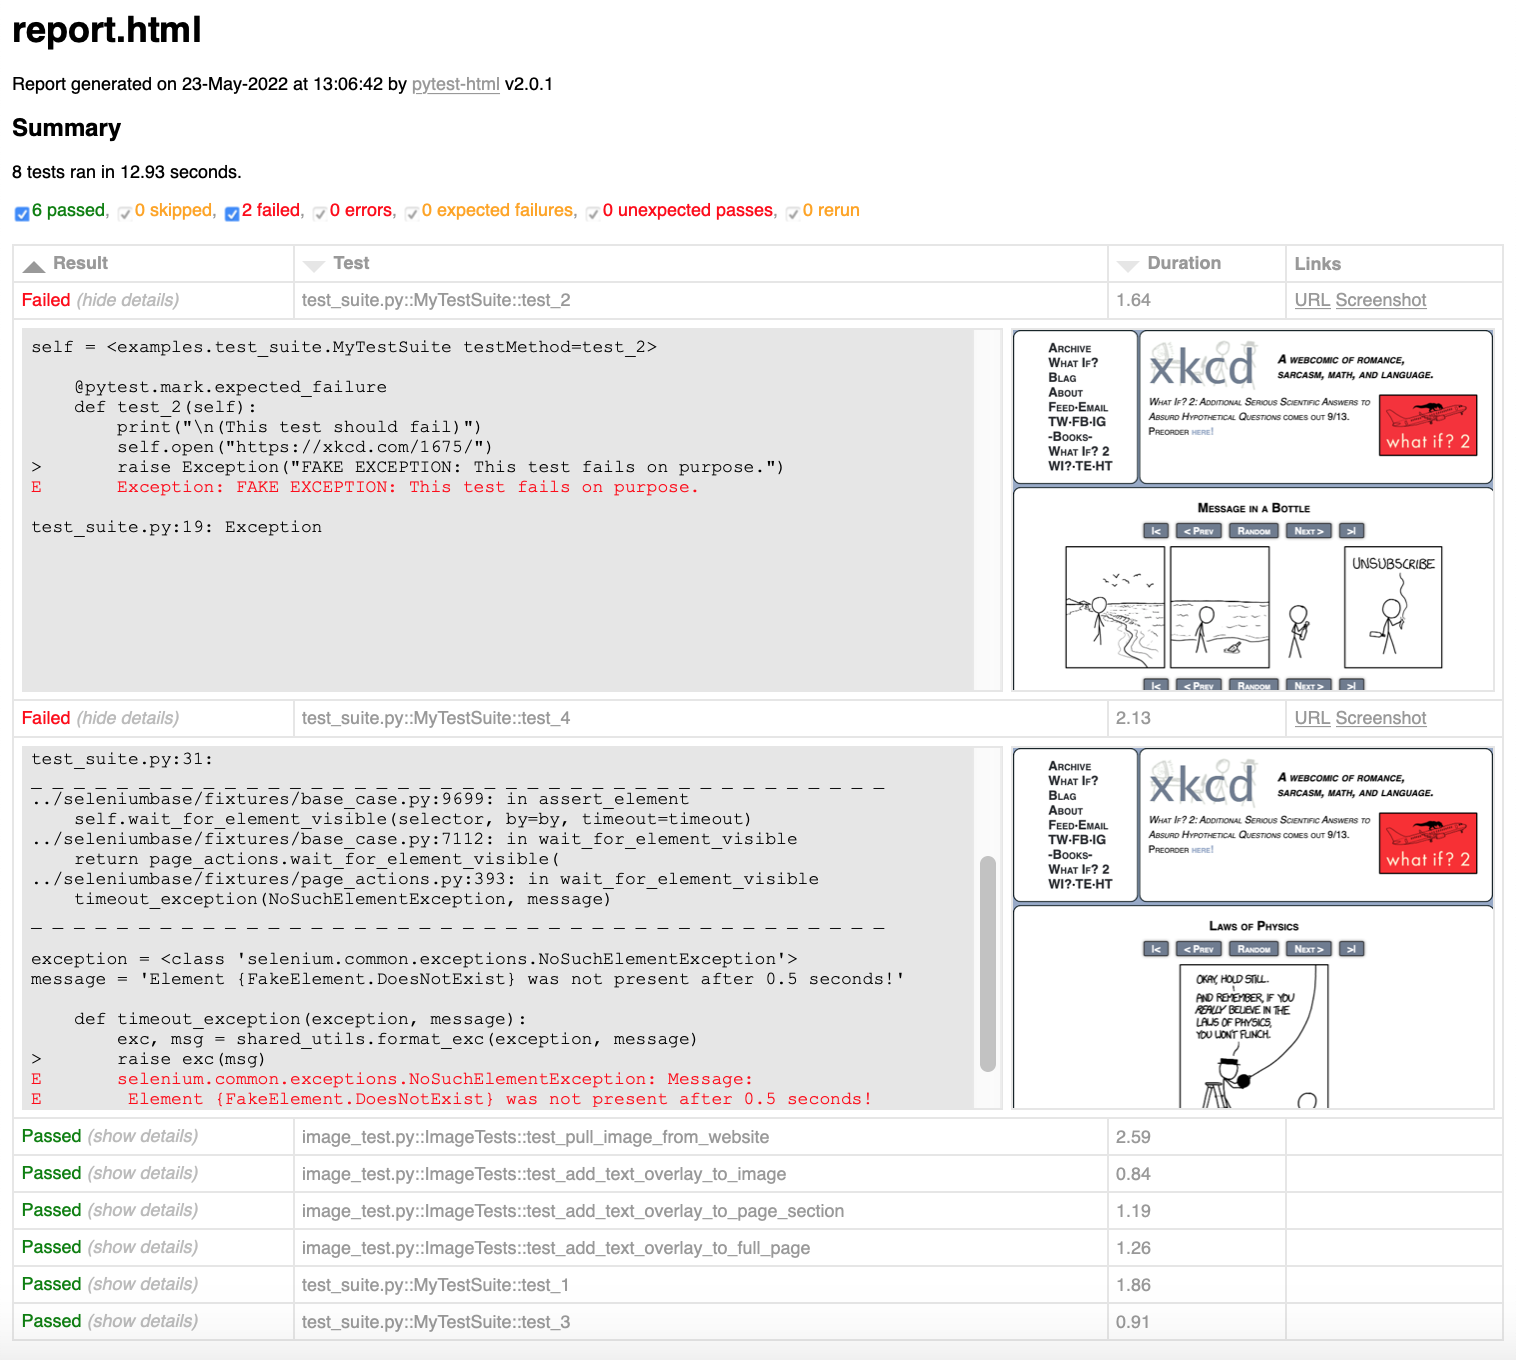
pytest test_suite.py test_image_saving.py --dashboard --rs --headless🔵 Using --html=report.html gives you a fancy report of the name specified after your test suite completes.
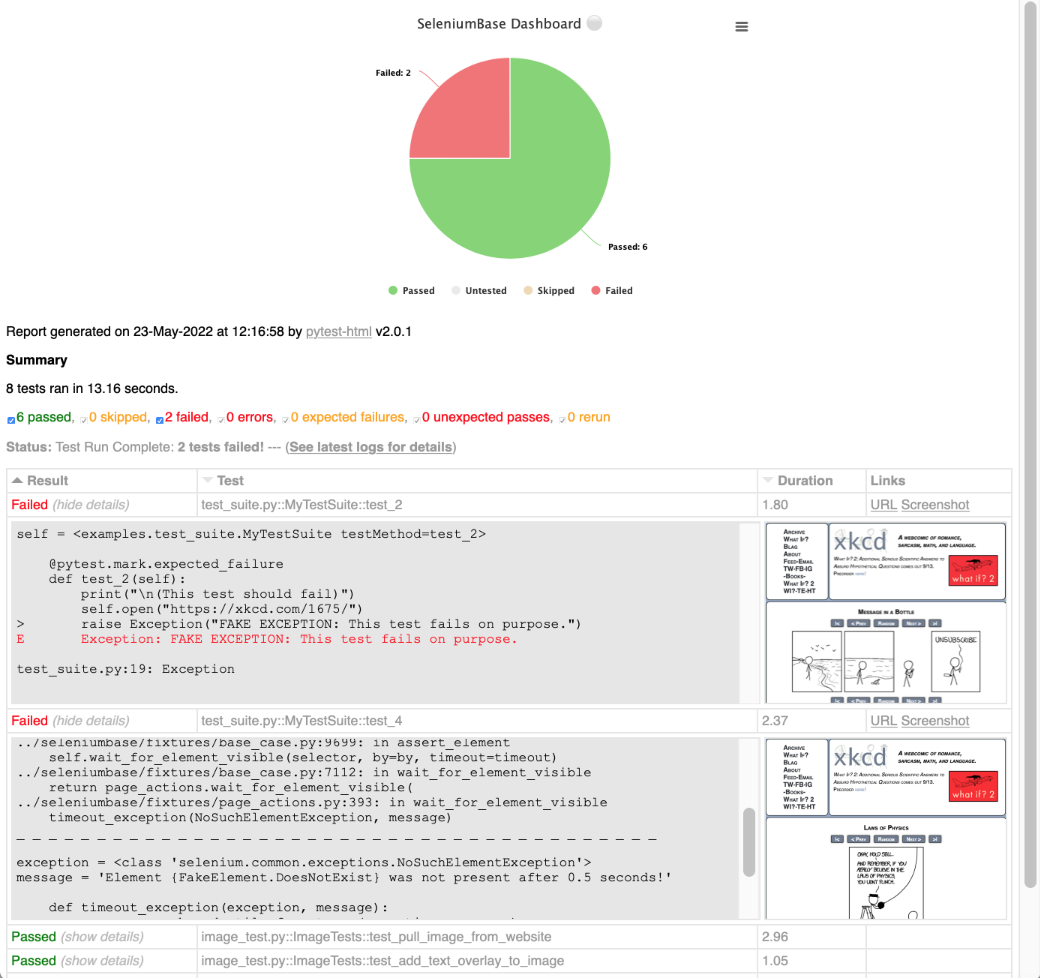
pytest test_suite.py --html=report.html🔵 When combining pytest html reports with SeleniumBase Dashboard usage, the pie chart from the Dashboard will get added to the html report. Additionally, if you set the html report URL to be the same as the Dashboard URL when also using the dashboard, (example: --dashboard --html=dashboard.html), then the Dashboard will become an advanced html report when all the tests complete.
🔵 Here's an example of an upgraded html report:
pytest test_suite.py --dashboard --html=report.htmlIf viewing pytest-html reports in Jenkins, you may need to configure Jenkins settings for the HTML to render correctly. This is due to Jenkins CSP changes. That setting can be changed from Manage Jenkins > Script Console by running:
System.setProperty("hudson.model.DirectoryBrowserSupport.CSP", "")You can also use --junit-xml=report.xml to get an xml report instead. Jenkins can use this file to display better reporting for your tests.
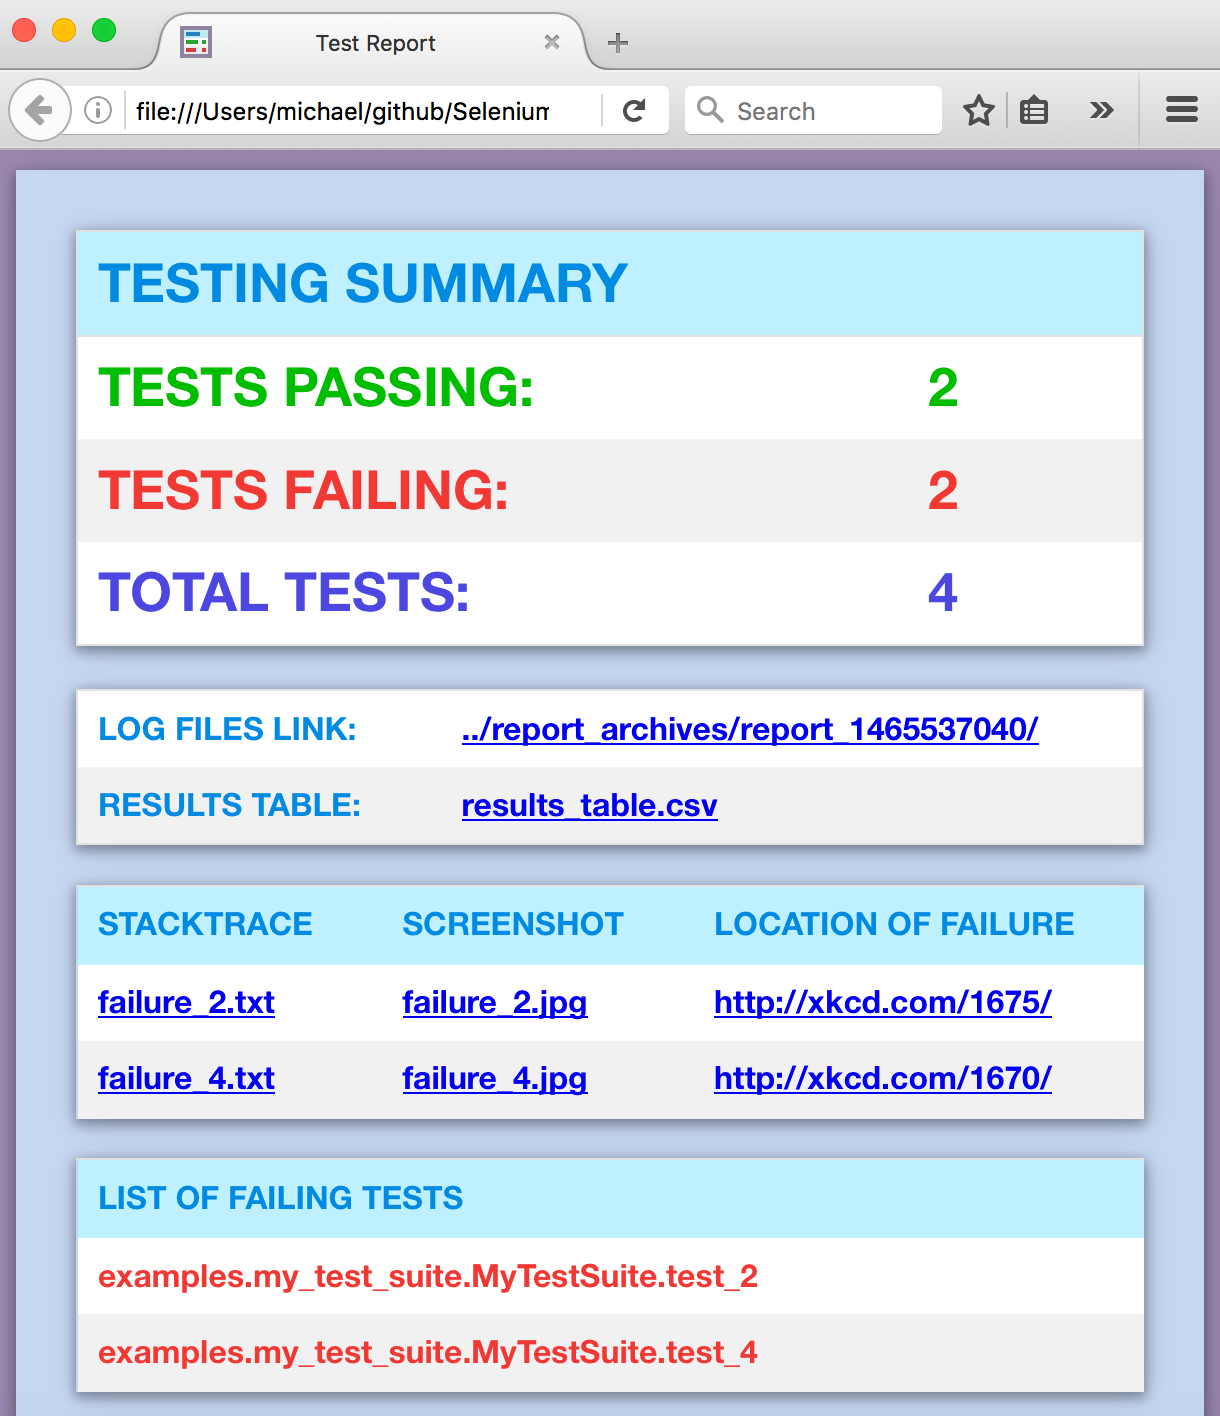
pytest test_suite.py --junit-xml=report.xmlThe pynose --report option gives you a fancy report after your tests complete.
pynose test_suite.py --report(NOTE: You can add --show-report to immediately display pynose reports after the test suite completes. Only use --show-report when running tests locally because it pauses the test run.)
(The behave_bdd/ folder can be found in the examples/ folder.)
behave behave_bdd/features/ -D dashboard -D headlessYou can also use --junit to get .xml reports for each Behave feature. Jenkins can use these files to display better reporting for your tests.
behave behave_bdd/features/ --junit -D rs -D headless