Build a Traffic Sign Recognition Project
The goals / steps of this project are the following:
- Load the data set (see below for links to the project data set)
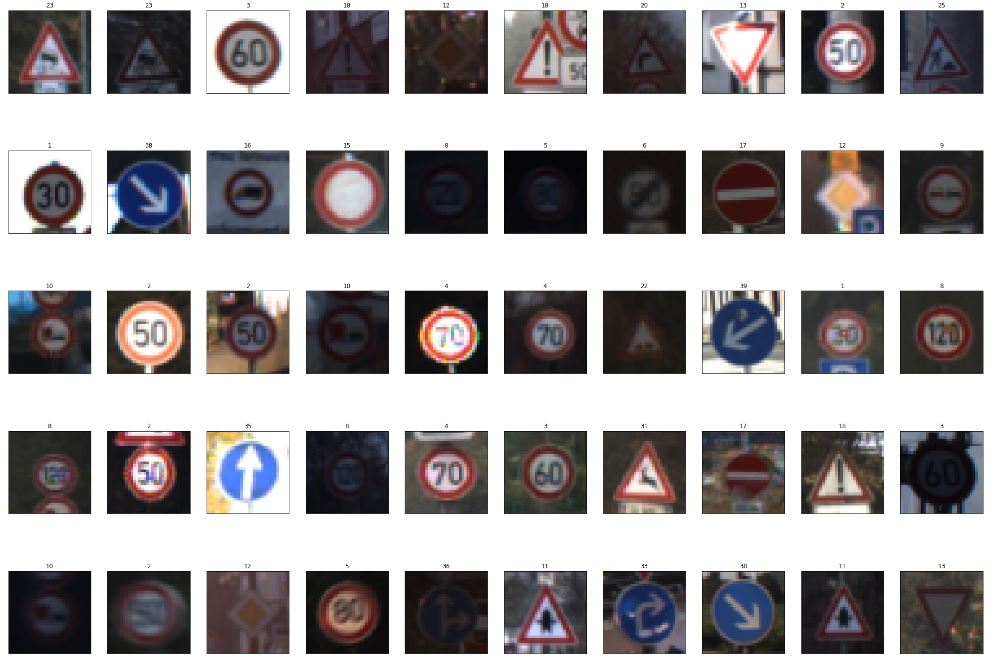
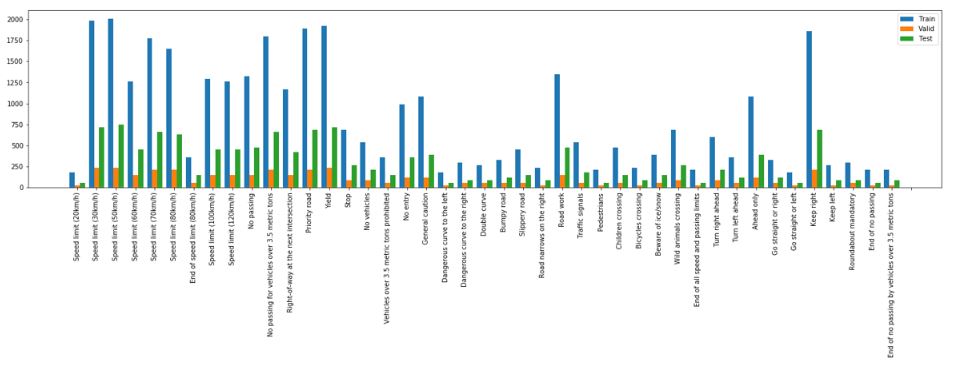
- Explore, summarize and visualize the data set
- Design, train and test a model architecture
- Use the model to make predictions on new images
- Analyze the softmax probabilities of the new images
- Summarize the results with a written report
The solutions to the questions have been provided in the file Traffic_Sign_Classifier.ipynb The HTML output of the code has been provided in the file Traffic_Sign_Classifier.html The project writeup has been provided in the current file (WriteUp.md) The images downloaded from the internet have been provided in the folder downloaded-images
A basic summary of the dataset has been provided: Number of training examples = 34799 Number of testing examples = 12630 Image data shape = (32, 32, 3) Number of classes = 43
In the preprocessing step, images have been
- Resized (only if needed - this step is only called on the images downloaded from the internet)
- Transformed to grayscale
- Normalized using cv2.normalize with the type NORM_MINMAX (normalization is the process of bringing the range of pixel intensity values to a normal distribution, in the effort of standardizing the input)
All the preprocessing steps have been taken in order to standardize as much as possible the input data. This steps help reduce the variability between the training and the testing sets and in doing so, improve the learning.
The model architecture is the basic LeNet Architecture
- Parameters: mu = 0 and sigma = 0.1
- The model consists of 5 layers with the following sizes:
- Layer 1: Convolutional. Input = 32x32x1. Output = 28x28x6.
- Layer 2: Convolutional. Input = 14x14x6. Output = 10x10x16.
- Layer 3: Fully Connected. Input = 400. Output = 120
- Layer 4: Fully Connected. Input = 120. Output = 84
- Layer 5: Fully Connected. Input = 84. Output = 43
The training has been done by using the AdamOptimizer
Training parameters: - Number of epochs: 25 - Batch size: 128 - Learning rate: 0.001 - Dropout percentage: 0.5
The solution has an accuracy of the validation set of over 93%
- In the beginning, I started off with 10 epochs but the accuracy was very low (never passed 85%). Through repetitive steps, I have selected 25 epochs as the optimal value.
- As the network was overfitting, the accuracy was around 91%, so I have added a dropout rate of 0.5
A set of 8 new images downloaded from the internet have been provided in the downloaded-images folder All images are correctly classified (Test Accuracy = 1.000)
The images downloaded from the internet are of very good quality so the network should be able to correctly classify them. I would expect more dificulty in determining the correct classification for the images: 3 (Wild animals crossing), 6 (Children crossing) and 7(Road work) because they are similar.
As previously stated, the quality of the downloaded images is high and so the accuracy of tests is 100%, compared to the accuracy of validation of only 94%.
Top five softmax probabilities for the predictions on the new images have been provided in the solution file
| Image | 1st probability | 2nd probability | 3rd probability | 4th probability | 5th probability |
|---|---|---|---|---|---|
| Image 0 | 4: 100.00% | 0: 0.00% | 1: 0.00% | 18: 0.00% | 2: 0.00% |
| Image 1 | 3: 99.75% | 5: 0.14% | 2: 0.11% | 12: 0.00% | 10: 0.00% |
| Image 2 | 31: 70.56% | 23: 16.59% | 25: 10.42% | 29: 1.53% | 20: 0.79% |
| Image 3 | 18: 100.00% | 26: 0.00% | 36: 0.00% | 25: 0.00% | 27: 0.00% |
| Image 4 | 11: 100.00% | 27: 0.00% | 30: 0.00% | 18: 0.00% | 23: 0.00% |
| Image 5 | 28: 40.51% | 30: 21.26% | 23: 18.57% | 29: 3.65% | 11: 3.50% |
| Image 6 | 25: 100.00% | 29: 0.00% | 20: 0.00% | 35: 0.00% | 22: 0.00% |
| Image 7 | 34: 96.44% | 38: 3.39% | 28: 0.07% | 32: 0.02% | 16: 0.01% |