Python Fuzzy Logic library based on Octave Fuzzy Logic Toolkit 0.4.6, considered as a mostly MATLAB-compatible fuzzy logic toolkit for Octave.
The way to use the fuzzylab functions is based on Matlab R2022a Fuzzy Logic Toolbox functions.
This library is more mature compared to the first version and will receive periodic updates.
- Setup a Python virtual envornement
- Step for setting up the environment...
- First you need to
git clone https://github.com/AUVSL/fuzzylab.git - Then you need to install the requirements:
pip install -r requirements.txt - Then you need to compile the library:
pip install ., which will allow you to install the library asfuzzylab - To verify the library installation you need to do
import fuzzylab; fuzzylab.__version__
NOTE: DO NOT INSTALL pip install fuzzylab AS THIS WILL INSTALL THE PYPI VERSION OF THE REPOSITORY
In the folder examples there are some code snippets and the equivalent matlab code for a starting point using the library.
We use fl as the alias for fuzzylab.
import fuzzylab as flimport fuzzylab as fl
import matplotlib.pyplot as plt
x = fl.arange(0, 0.1, 10)
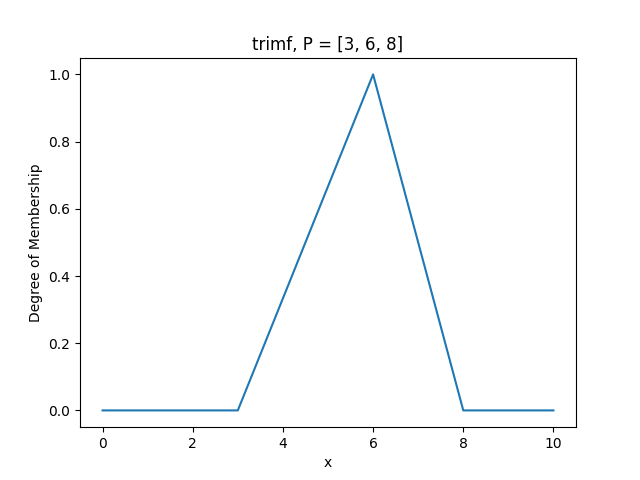
y = fl.trimf(x, [3, 6, 8])
plt.plot(x,y)
plt.title('trimf, P = [3, 6, 8]')
plt.xlabel('x')
plt.ylabel('Degree of Membership')
plt.ylim([-0.05, 1.05])
plt.show()Also we can use a more matlab code style
from fuzzylab import arange, trimf
from matplotlib.pyplot import plot, title, xlabel, ylabel, ylim, show

x = arange(0, 0.1, 10)
y = trimf(x, [3, 6, 8])

plot(x,y)
title('trimf, P = [3, 6, 8]')
xlabel('x')
ylabel('Degree of Membership')
ylim([-0.05, 1.05])
show()@Inbook{Avelar2020,
author="Avelar, Eduardo
and Castillo, Oscar
and Soria, Jos{\'e}",
editor="Castillo, Oscar
and Melin, Patricia
and Kacprzyk, Janusz",
title="Fuzzy Logic Controller with Fuzzylab Python Library and the Robot Operating System for Autonomous Robot Navigation: A Practical Approach",
bookTitle="Intuitionistic and Type-2 Fuzzy Logic Enhancements in Neural and Optimization Algorithms: Theory and Applications",
year="2020",
publisher="Springer International Publishing",
address="Cham",
pages="355--369",
isbn="978-3-030-35445-9",
doi="10.1007/978-3-030-35445-9_27",
url="https://doi.org/10.1007/978-3-030-35445-9_27"
}
