Skip to content
New issue

Have a question about this project? Sign up for a free GitHub account to open an issue and contact its maintainers and the community.

By clicking “Sign up for GitHub”, you agree to our terms of service and privacy statement. We’ll occasionally send you account related emails.

Already on GitHub? Sign in to your account

barplot overlay on US state map visualization tool #106

Closed
victoriahunt opened this issue Apr 26, 2020 · 5 comments
Closed

barplot overlay on US state map visualization tool #106

victoriahunt opened this issue Apr 26, 2020 · 5 comments
Labels
new feature Feature that is currently in progress.
Milestone

Comments

@victoriahunt
Copy link
Contributor

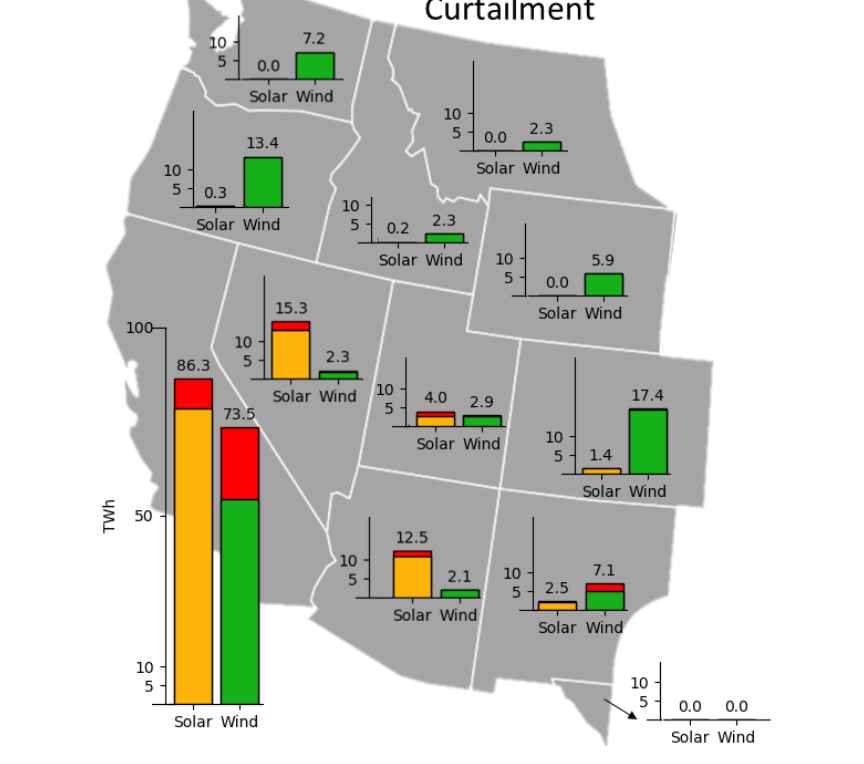
We have been showing plots like this one, which was done using image editing and is not automated. There is a need to do this in an automated fashion, integrated into the code base.
image.png

@victoriahunt victoriahunt added the new feature Feature that is currently in progress. label Apr 26, 2020
@victoriahunt victoriahunt added this to the Spring Board milestone Apr 26, 2020
@victoriahunt victoriahunt self-assigned this Apr 26, 2020
@victoriahunt
Copy link
Contributor Author

Using vbar (vertical bar) glyphs in Bokeh, we can create this sort of plot in Bokeh directly. Because of differences in sizes of bars and irregular US state shapes, there is some customization that is required to make it easier to see what is going on (which bars go with which state etc):
image.png

@victoriahunt
Copy link
Contributor Author

victoriahunt commented Apr 27, 2020

Bar size, legend, and bar placement on US states has been optimized for WECC. I may need to do some readjustment and customization for other interconnections. Definitely parameters would need to be adjusted if using this functionality for other fields that have different ranges: image.png

@victoriahunt
Copy link
Contributor Author

Example using a scenario with higher emissions, demonstrating reasonable placement of labels and bars: image.png

@victoriahunt
Copy link
Contributor Author

size factor added, to allow for relative height adjustment: image.png

@victoriahunt
Copy link
Contributor Author

Sanity check on totals against previous code used to produce overall barplots: image.png

victoriahunt added a commit that referenced this issue Apr 27, 2020
feat: bar plots on US states map per us state, for emissions, issue PostREISE #106
Sign up for free to join this conversation on GitHub. Already have an account? Sign in to comment
Labels
new feature Feature that is currently in progress.
Projects
None yet
Development

No branches or pull requests

1 participant