You signed in with another tab or window. Reload to refresh your session.You signed out in another tab or window. Reload to refresh your session.You switched accounts on another tab or window. Reload to refresh your session.Dismiss alert
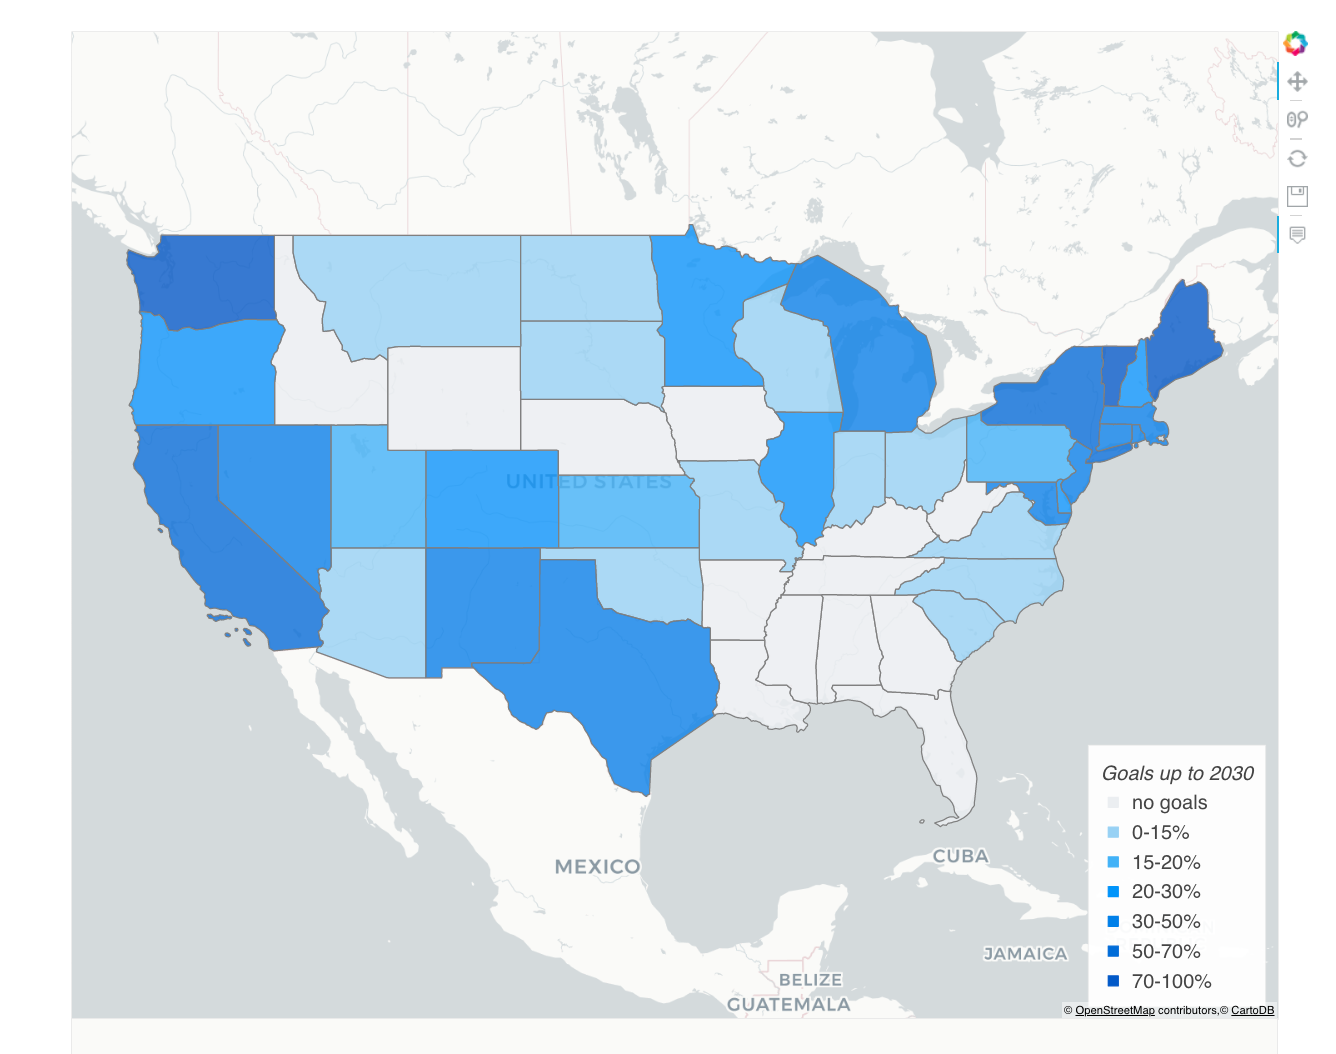
In PostREISE/postreise/plot/plot_carbon_map.py there is a function to plot states color coded by a value and to add labels to states. Several aesthetic improvements have been made since that early version of the function was developed, including updating colors to the BE color scheme, and adding hover over tool tips to display detailed goals info, rather than creating citations on the image directly. There is a need to include the code used to make the scrolly-telling version of this function in the code base, and to make a demo notebook that will create the actual image used on scrolly-telling. Here is the state goals image as it appears on scrolly-telling currently:
The text was updated successfully, but these errors were encountered:
…update2

Map state RPS goals update for web compatibility and demo notebook with parameters used for the scrolly telling version of this map as of 9/24/2020. Relates to zenhub issue #175
In PostREISE/postreise/plot/plot_carbon_map.py there is a function to plot states color coded by a value and to add labels to states. Several aesthetic improvements have been made since that early version of the function was developed, including updating colors to the BE color scheme, and adding hover over tool tips to display detailed goals info, rather than creating citations on the image directly. There is a need to include the code used to make the scrolly-telling version of this function in the code base, and to make a demo notebook that will create the actual image used on scrolly-telling. Here is the state goals image as it appears on scrolly-telling currently:

The text was updated successfully, but these errors were encountered: