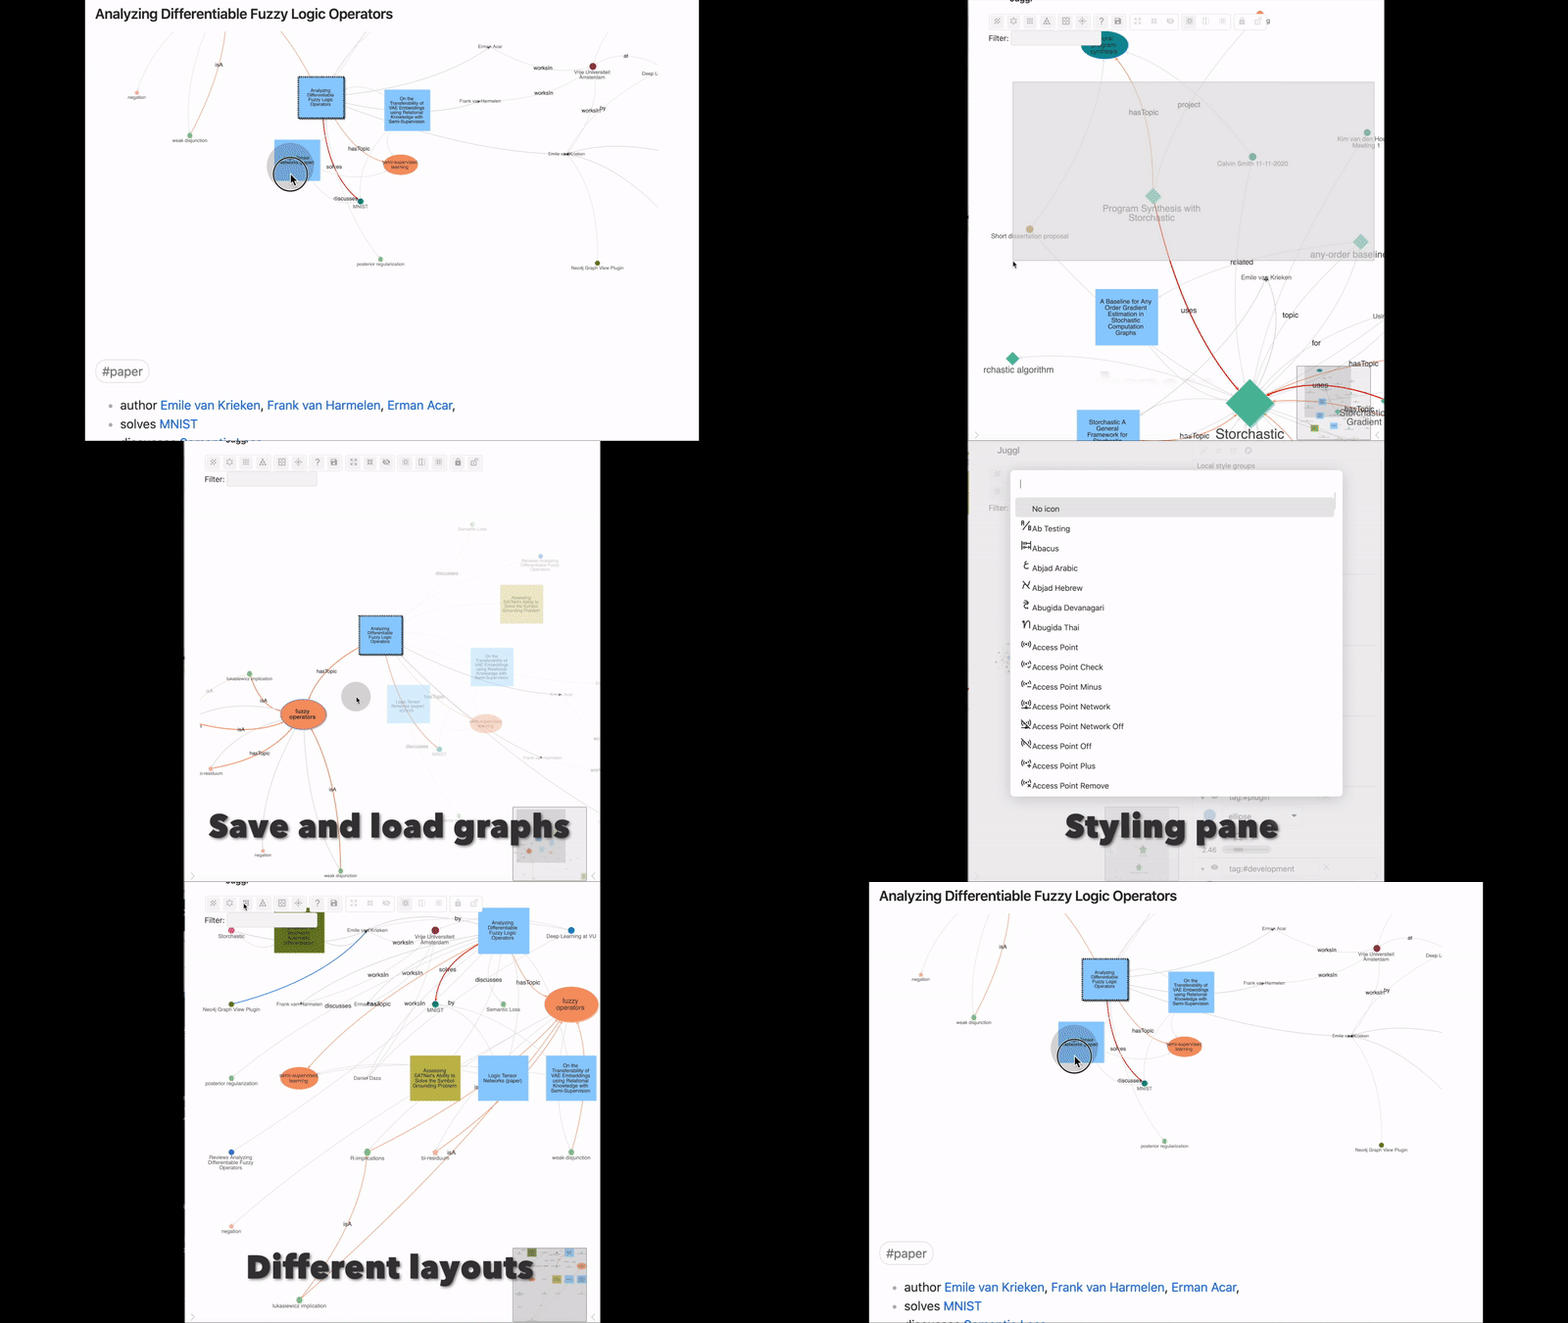
Juggl is a completely interactive, stylable and expandable graph view for Obsidian. It is designed as an advanced 'local' graph view called the 'workspace', where you can juggle all your thoughts with ease: By navigating your vault through a beautiful graph!
For example, you can select what parts of the graph to expand, to make sure there is never too much information on the screen. You will have complete control over the style of your graph using the powerful Cytoscape.js library: Juggl has a useful styling pane nodes colors, shapes, sizes, and icons. This helps you get an immediate overview over what the content of each node is.
Juggl has many features unique to its graph view compared to the Obsidian graph view:
- Complete control over the style of your graph using CSS, YAML and the Style Pane .
- Include images!
- A Workspace mode that lets you build your graph with all nodes that are relevant to your current project
- Selectively browse and hide nodes, and pin their location so you never lose them
- Write new ideas and see your graph evolve
- Save your graph and continue working on it later
- 4 different layouts to get unique insights
- A code block that displays the graph within Obsidian notes
- Link type support to label edges
- Tight integration with the very useful Breadcrumbs plugin
- Extendable through other plugins
- Works on mobile!
You can open Juggl from the 'more options' menu on files:

You can interact with the graph with many of the same options as in Obsidian. For further documentation, check out juggl.io, where you can find information on for example styling or the syntax of the code block.
You can also open the help vault with this button in Juggl:

Juggl is completely open source and has an API available for creating Obsidian plugins that extend or use Juggl. See https://github.com/HEmile/juggl-api . You will have complete control over the internals of Cytoscape.js, which is an extremely powerful graph visualization library!


