Reports on AWS costs grouped by 'team' using data from CloudCheckR
We've got multiple agile development teams using AWS on various projects. We like to keep the dev AWS accounts as "open" as possible for the teams to encourage experimentation but tracking the costs is a bit tricky. AWS tagging is not available on every service (still!) and we have the concept of individual and shared team resources.
This tool allows you to create a configuration file defining a 'team' and what AWS resources they own at the shared level and the individual level. Currently it can track EC2, S3, DynamoDB and Elastic Beanstalk resources using data derived from CloudCheckR reports. However, the tool uses a plugin model and is extensible to other AWS services should the need arise. As long as CloudCheckR can report on it, the tool can aggregate the data.
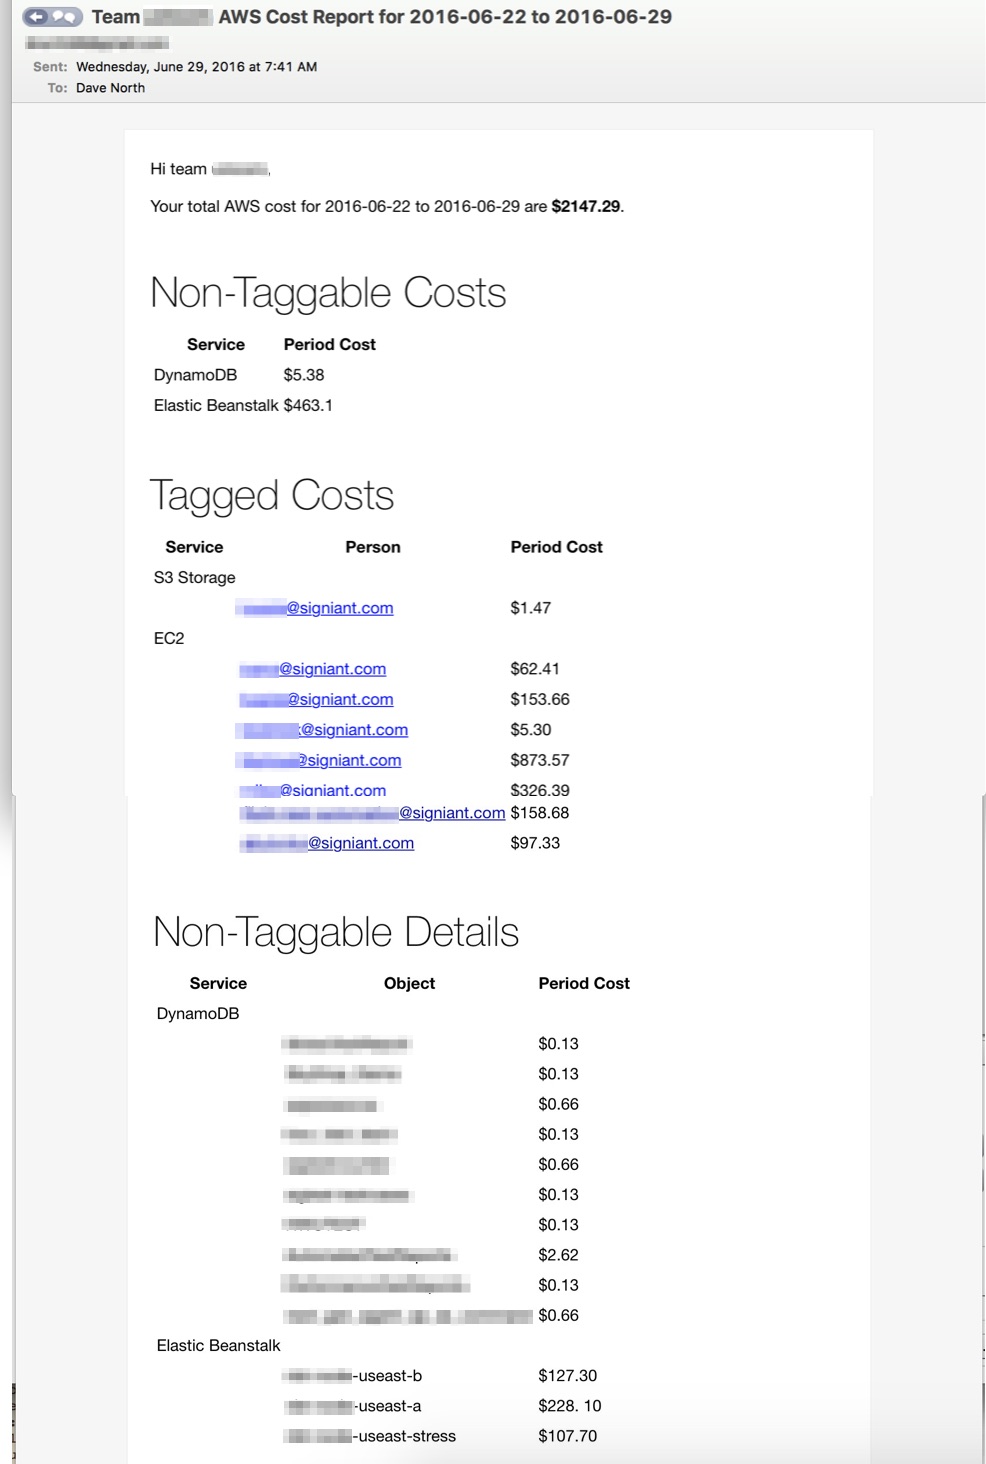
The email report that gets generated for each team looks something like this...
- You must have a CloudCheckR subscription. Go get one now, it's a fantastic tool
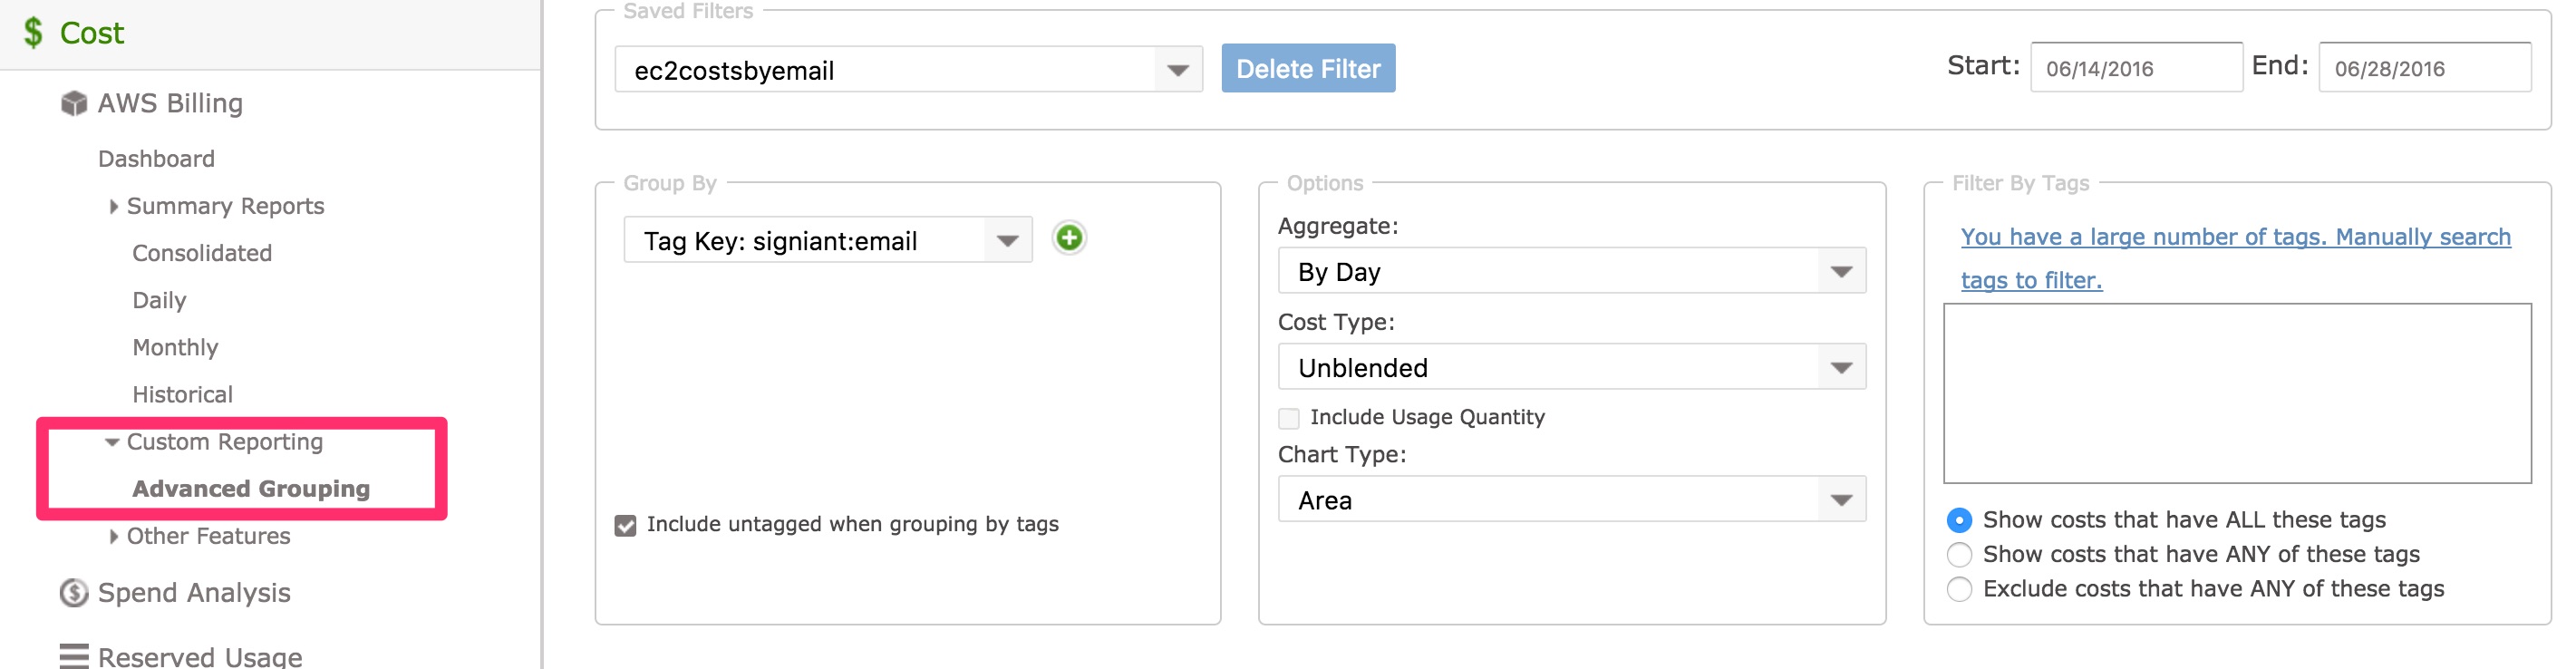
- You should have a tag defined on EC2 and S3 resources that you can report on. We use "signiant:email" as our tag name but it can be anything. Have a look at our auto-tagger which can automatically add tags to EC2 resources as well
- You'll need to configure AWS billing to dump stats for your tags.
- You'll need 4 custom grouping reports defined in cloudcheckr:
- 1 for EC2 resources with your tag
- 1 for S3 resources with your tag
- 1 for all resources with the elasticbeanstalk:environment-name tag
- 1 for all resources with the aws:cloudformation:stack-name tag (for obtaining ECS cluster stats. Your cluster must be launched by using cloudformation)
- Something like this:
- For DynamoDB, we use the standard cloudCheckR inventory report
- A config file defining your teams. A sample is included in the project
- You'll probably want an email distribution list to send the report to the team (ie. [email protected])
The easiest way to run the tool is from docker (because docker rocks). You just pass it a team name and a config file and it will do everything from there
docker pull signiant/aws-team-cost-reporterdocker run \
-v /config/myconfigfile.yaml:/config.yaml \
signiant/aws-team-cost-reporter \
-c /config.yaml \
-t team-oneIn this example, we use a bindmount to mount in the config file from a local folder to the root directory of the container. We can then pass the -c argument to the container to have it read the config from / and use the team name of team-one.
There is an optional -d flag to the tool which will turn on more debug output. For example:
docker run -ti \
   -v /config/myconfigfile.yaml:/config.yaml \
   signiant/aws-team-cost-reporter \
        -c /config.yaml \
        -t team-one \
-dAs the final step of running, the tool will write the team cost data to /output/TEAM_NAME.json. This can then be accessed by other tools by using a bind mount into the running container. For example:
docker run -ti \
   -v /config/myconfigfile.yaml:/config.yaml \
   -v /localoutput:/output \
   signiant/aws-team-cost-reporter \
        -c /config.yaml \
        -t team-one \
        -d
Each team data will be written to a seperate json file.
The project is structured as follows:
- team-cost-reporter.py - this really just invokes each plugin and calls the output formatter
- plugins - one plugin per AWS service. The plugin should have a getTeamCost function which returns an array of shared or individual costs
- templates - contains a base html email template using [keyword] where values should be substituted
- output.py - reads the email template and substitues in the values reported by all the plugins into the email
- cloudcheckr.py - generically calls a cloudcheckr API endpoint and handles the fact that the data returned may be paged. Also adds on the date filters depending on how many days are specified in the config file to report data for
- mail.py - uses a forked version of ludmal's mail.py to send html emails