Includes:
list-like object of Twitter statuses. (Tweetsclass)- horizontal bar charts (word frequency plot, ...), 2-sided horizontal bar charts, radial bar charts (word frequency plot), scatter plots, and histograms
- models:
Tweets,Authors,Splits.
Requirements :
- Python 3.5
- Tweepy
- Numpy
- Matplotlib
Useful article(s) :
https://marcobonzanini.com/2015/03/02/mining-twitter-data-with-python-part-1/
from statistweepy import models
import matplotlib.pyplot as plt
import numpy

stats = numpy.load('ProSyn_3000_12_8_2018_extended.npy') #You can get this data from the 'samples' folder.
tweets = models.Tweets(stats)
model = models.Authors(tweets)

fig, ax = plt.subplots(1, 1)
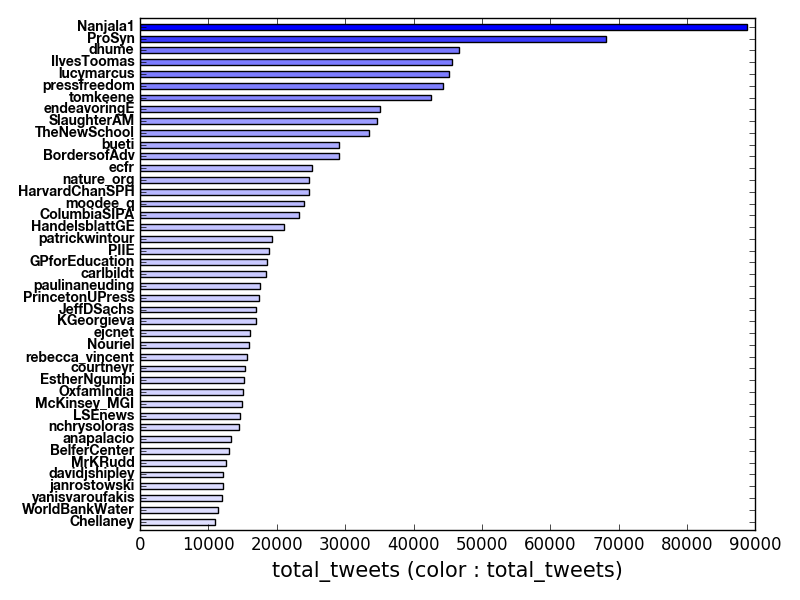
model.hbar_plot(ax, meas = 'total_tweets', \
                incolor_meas = 'total_tweets', \
                text_sizes = [10, 15], \
                freq_lim = (10000, 1000000))
fig.show()
result:
from statistweepy import models
import matplotlib.pyplot as plt
import numpy

stats = numpy.load('ProSyn_3000_12_8_2018_extended.npy')
tweets = models.Tweets(stats)
model = models.Authors(tweets)

fig, ax = plt.subplots(1, 1)
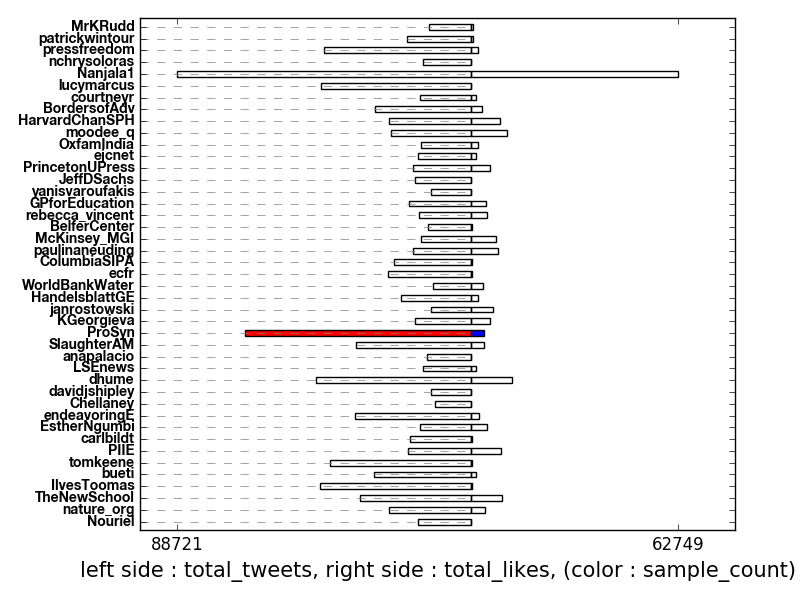
model.hbar2sided_plot(ax, meas_left = 'total_tweets', \
                      meas_right = 'total_likes', \
                      incolor_meas = 'sample_count', \
                      aux_size = 0.5, \
                      text_sizes = [10, 15], space = True, \
                      freq_lim = ('left', (10000, 1000000))
                      )
fig.show()
result:
from statistweepy import models
import matplotlib.pyplot as plt
import numpy

stats = numpy.load('ProSyn_3000_12_8_2018_extended.npy')
tweets = models.Tweets(stats)
model = models.Authors(tweets)

fig, ax = plt.subplots(1, 1)
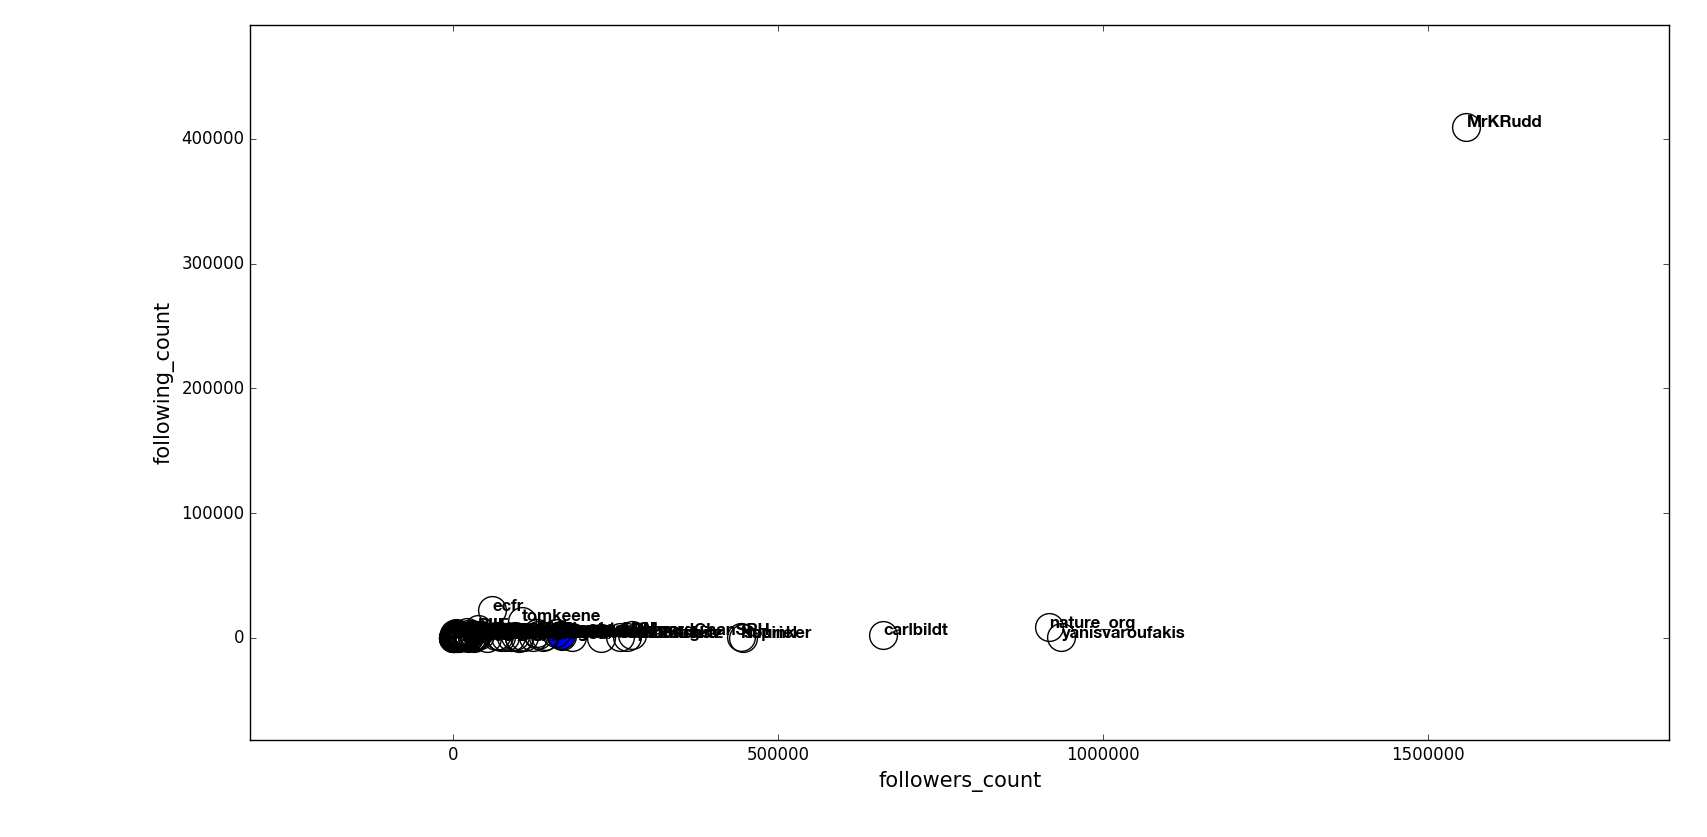
model.scatter_plot(ax, incolor_meas = 'sample_count', \
                   text_sizes = [12, 15], \
                   marker_size = 20, color = 'blue')
fig.show()
result:
from statistweepy import models
import matplotlib.pyplot as plt
import numpy

stats = numpy.load('ProSyn_3000_12_8_2018_extended.npy')
tweets = models.Tweets(stats)
model = models.Splits(tweets, naive = False)

#Excluded words
exc_splits = ('the', 'if', 'The', 'is', 'on', 'are', 'we', 'on', 'at', 'not', 'of', 'to', \
              'than', 'and', 'for', 'that', 'be', 'it', 'in', 'or', 'as')
#Create an adjustment : only include words that appeared between 110 to 10000 times,
# and each the length of each word must be between 3 to 100.
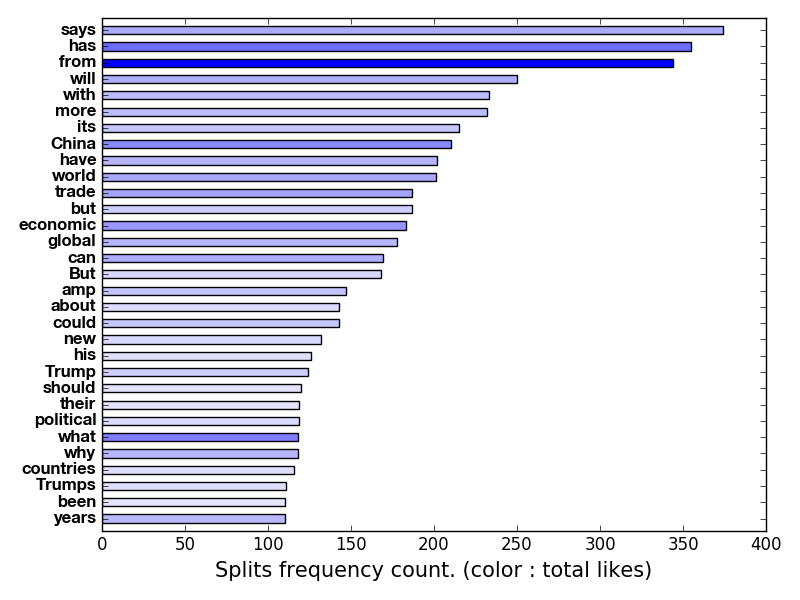
adjustment = models.Adjustment(freq_lim = (110, 10000), char_lim = (3, 100), exclude = exc_splits)

fig, ax = plt.subplots(1, 1)
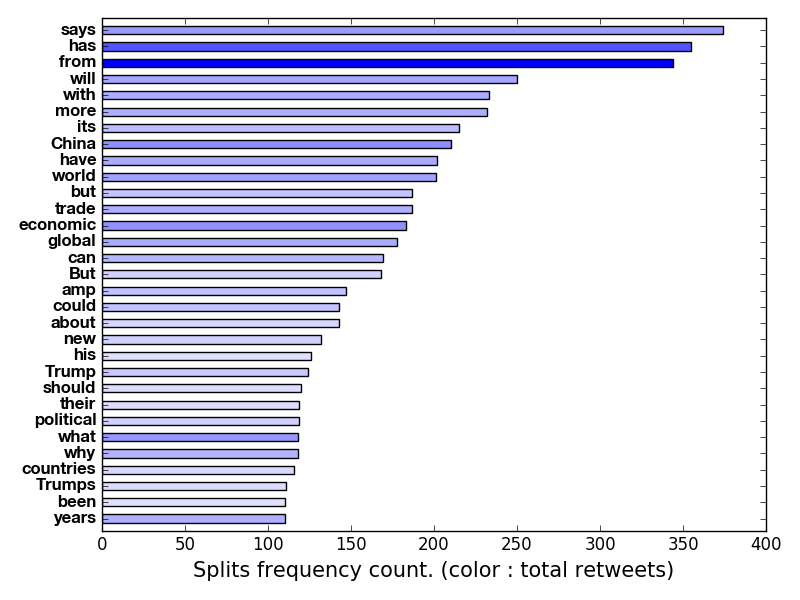
model.hbar_plot(ax, adjustment = adjustment, color = 'blue', incolor  = 'likes', text_sizes = [12, 15])
fig.show()
result:
from statistweepy import models
import matplotlib.pyplot as plt
import numpy

stats = numpy.load('ProSyn_3000_12_8_2018_extended.npy')
tweets = models.Tweets(stats)
model = models.Splits(tweets, naive = False)

#Excluded words
exc_splits = ('the', 'if', 'The', 'is', 'on', 'are', 'we', 'on', 'at', 'not', 'of', 'to', \
              'than', 'and', 'for', 'that', 'be', 'it', 'in', 'or', 'as')
#Create an adjustment : only include words that appeared between 110 to 10000 times,
# and each the length of each word must be between 3 to 100.
adjustment = models.Adjustment(freq_lim = (110, 10000), char_lim = (3, 100), exclude = exc_splits)

fig, ax = plt.subplots(1, 1)
model.hbar_plot(ax, adjustment = adjustment, color = 'blue', incolor  = 'retweets', text_sizes = [12, 15])
fig.show()
result:
from statistweepy import models
import matplotlib.pyplot as plt
import numpy

stats = numpy.load('ProSyn_3000_12_8_2018_extended.npy')
tweets = models.Tweets(stats)
model = models.Splits(tweets, naive = False)

#Excluded words
exc_splits = ('the', 'if', 'The', 'is', 'on', 'are', 'we', 'on', 'at', 'not', 'of', 'to', \
              'than', 'and', 'for', 'that', 'be', 'it', 'in', 'or', 'as')
#Create an adjustment : only include words that appeared between 110 to 10000 times,
# and each the length of each word must be between 3 to 100.
adjustment = models.Adjustment(freq_lim = (110, 10000), char_lim = (3, 100), exclude = exc_splits)

fig, ax = plt.subplots(1, 1)
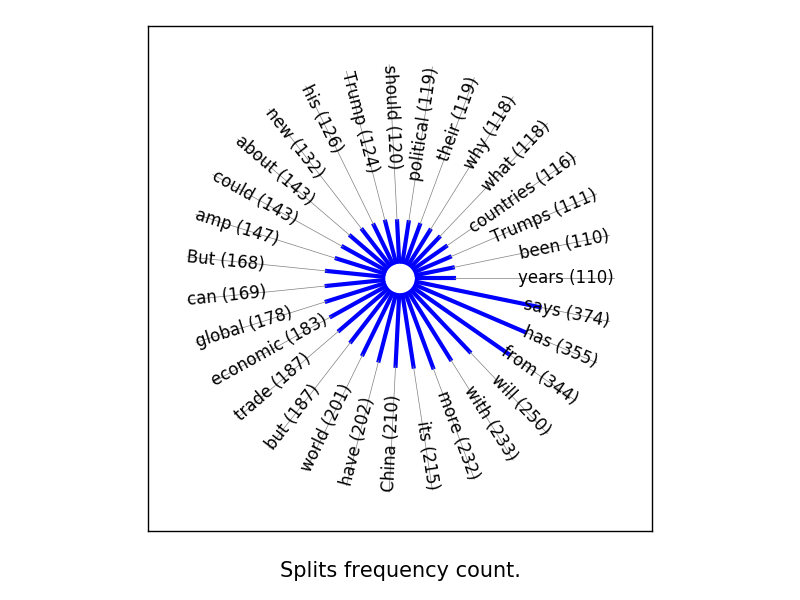
model.rbar_plot(ax, adjustment = adjustment, color = 'blue', bar_width = 3, base_radius = 100, text_sizes = [12, 15])
fig.show()
result:
from statistweepy import models
import matplotlib.pyplot as plt
import numpy

stats = numpy.load('ProSyn_3000_12_8_2018_extended.npy')
tweets = models.Tweets(stats)
model = models.Splits(tweets, naive = False)

#Excluded words
exc_splits = ('the', 'if', 'The', 'is', 'on', 'are', 'we', 'on', 'at', 'not', 'of', 'to', \
              'than', 'and', 'for', 'that', 'be', 'it', 'in', 'or', 'as')
#Create an adjustment : only include words that appeared between 50 to 10000 times,
# and each the length of each word must be between 3 to 100.
adjustment = models.Adjustment(freq_lim = (50, 10000), char_lim = (3, 100), exclude = exc_splits)

fig, ax = plt.subplots(1, 1)
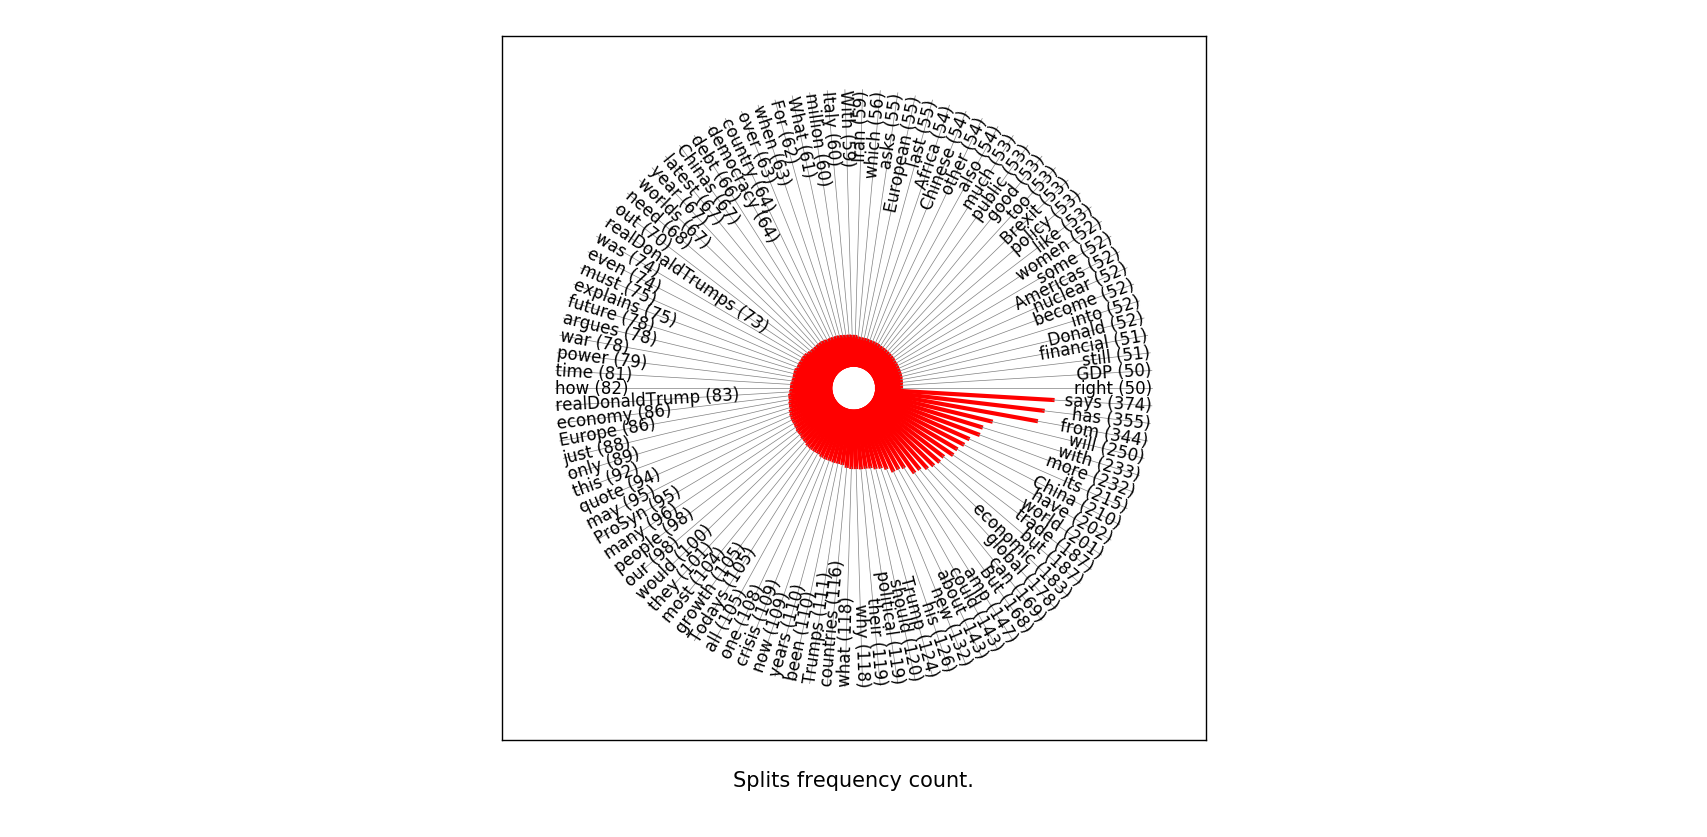
model.rbar_plot(ax, adjustment = adjustment, color = (1, 0, 0, 1), bar_width = 3, base_radius = 100, text_sizes = [12, 15])
fig.show()
result:
To collect the data you must have a 'consumer key', 'consumer secret', 'access token', and 'access secret', that can be obtained by register for a Twitter application. These will be used to access Twitter API through your Twitter account, and should be kept private. Notice also that you should read and peruse the Twitter Developer Agreement and Policy carefully, you may not use the data carelessly for example to do surveillance, provoke negative conflicts, etc.
Here is an example of how we can collect the data :
from statistweepy.collection import Authentication
from statistweepy.collection import Collection

consumer_key = '****'
consumer_secret = '****'
access_token = '****'
access_secret = '****'

Auth = Authentication(consumer_key, consumer_secret, access_token, access_secret)
Collect = Collection(Auth)

Collect.collect_home()
tweets = Collect.collection
This first creates an 'authentication' object of Authentication, which access the Twitter API. This object is then required as input for Collection class. To use the Twitter data, get data.collection.
Currently, there are three models, setup in Tweets, Authors, and Splits class.
We will see how we can use Tweets class:
import numpy
from statistweepy.models import Tweets

stats = numpy.load('testfile.npy')
tweets = Tweets(stats)
This will create a Tweets object named tweets, which is a list-like object containing tweets (tweepy.models.Status objects).
View tweets by specific interval :
>>> tweets.view(0, 3)
[0] by @FIFAWorldCup : b'\xf0\x9f\x98\x8d\n\n#FRACRO // #WorldCupFinal https://t.co/w227YQWA0A'
[1] by @Reuters : b"Iran's supreme leader calls for government to be backed in face of U.S. sanctions https://t.co/E8EDZBO0MP"
[2] by @TEDTalks : b'Play with your garbage. It\xe2\x80\x99s for science! https://t.co/pxweO6XMIP'
[3] by @AdamMGrant : b'When we\xe2\x80\x99re deprived of freedom at work, we become more controlling at home. Granting people autonomy on the job isn\xe2\x80\xa6 https://t.co/nS7QZW7b60'
>>> tweets.view(0, 3, attr = 'retweet_count')
[0] by @FIFAWorldCup : 1101
[1] by @Reuters : 1
[2] by @TEDTalks : 3
[3] by @AdamMGrant : 7

