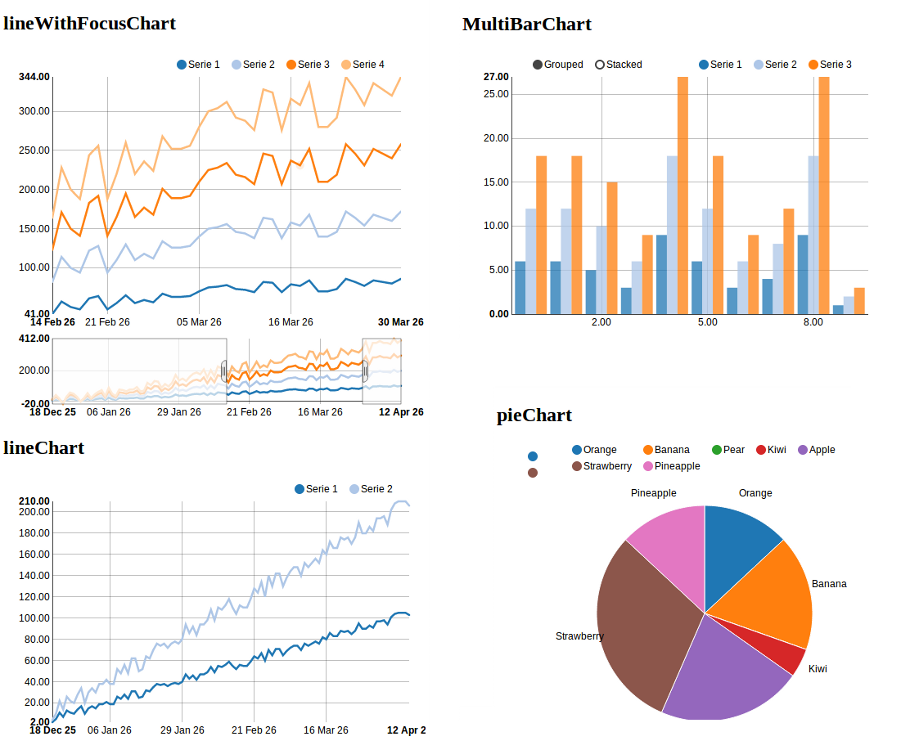
| Description: | Python-nvd3 is a wrapper for NVD3 graph library |
|---|---|
| NVD3: | NVD3 http://nvd3.org/ |
| D3: | Data-Driven Documents http://d3js.org/ |
| Maintainers: | Areski & Oz |
| Contributors: | list of contributors |


NVD3 is an attempt to build re-usable charts and chart components for d3.js without taking away the power that d3.js offers you.
Python-NVD3 makes your life easy! You write Python and the library renders JavaScript for you! These graphs can be part of your web application:
Want to try it yourself? Install python-nvd3, enter your python shell and try this quick demo:
>>> from nvd3 import pieChart
>>> chart_name = 'pieChart'
>>> chart = pieChart(name=chart_name, color_category='category20c', height=450, width=450)
>>> xdata = ["Orange", "Banana", "Pear", "Kiwi", "Apple", "Strawberry", "Pineapple"]
>>> ydata = [3, 4, 0, 1, 5, 7, 3]
>>> extra_serie = {"tooltip": {"y_start": "", "y_end": " cal"}}
>>> chart.add_serie(y=ydata, x=xdata, extra=extra_serie)
>>> chart.buildcontent()
>>> print chart.htmlcontent
This will output the following HTML to render a live chart. The HTML could be stored into a HTML file, used in a Web application, or even used via Ipython Notebook:
<div id="pieChart"><svg style="width:450px;height:450px;"></svg></div>
<script>
data_pieChart=[{"values": [{"value": 3, "label": "Orange"},
               {"value": 4, "label": "Banana"},
               {"value": 0, "label": "Pear"},
               {"value": 1, "label": "Kiwi"},
               {"value": 5, "label": "Apple"},
               {"value": 7, "label": "Strawberry"},
               {"value": 3, "label": "Pineapple"}], "key": "Serie 1"}];

nv.addGraph(function() {
    var chart = nv.models.pieChart();
    chart.margin({top: 30, right: 60, bottom: 20, left: 60});
    var datum = data_pieChart[0].values;
            chart.tooltipContent(function(key, y, e, graph) {
                var x = String(key);
                var y =  String(y)  + ' cal';
                tooltip_str = '<center><b>'+x+'</b></center>' + y;
                return tooltip_str;
            });
        chart.showLegend(true);
        chart.showLabels(true);
        chart.donut(false);
    chart
        .x(function(d) { return d.label })
        .y(function(d) { return d.value });
    chart.width(450);
    chart.height(450);
    d3.select('#pieChart svg')
        .datum(datum)
        .transition().duration(500)
        .attr('width', 450)
        .attr('height', 450)
        .call(chart);
});
</script>
Check out the documentation on Read the Docs for some live Chart examples!
Install, upgrade and uninstall python-nvd3 with these commands:
$ pip install python-nvd3
$ pip install --upgrade python-nvd3
$ pip uninstall python-nvd3
D3 and NvD3 can be installed through bower (which itself can be installed through npm). See http://bower.io/ and https://npmjs.org for further information. To install bower globally execute:
$ npm install -g bower
Note : you might prefer to save your npm dependencies locally in a package.json file.
Then in the directory where you will use python-nvd3, just execute the following commands:
$ bower install d3#3.5.17
$ bower install nvd3#1.8.6
This will create a directory "bower_components" where d3 & nvd3 will be saved.
Note : you might prefer to save your bower dependencies locally in a bower.json file.
You can also configure the directory where your bower dependencies will be
saved adding a .bowerrc file in your project root directory.
There is also a django wrapper for nvd3 available: https://github.com/areski/django-nvd3
Python-NVD3 works nicely within IPython Notebooks (thanks to @jdavidheiser)
See the examples directory for an Ipython notebook with python-nvd3.
Python-nvd3 is licensed under MIT, see MIT-LICENSE.txt.
If you want to help maintain this project, please get in touch.
