-
Notifications
You must be signed in to change notification settings - Fork 8.3k
New issue
Have a question about this project? Sign up for a free GitHub account to open an issue and contact its maintainers and the community.
By clicking “Sign up for GitHub”, you agree to our terms of service and privacy statement. We’ll occasionally send you account related emails.
Already on GitHub? Sign in to your account
kibana not displaying dashboard #878
Comments
|
Looks like perhaps you don't have javascript enabled? Hard to make a call here, can you take a look at the chrome debug console and see if you get any output? Something isn't executing. |
|
Looks like you have a typo in your config.js somewhere. |
|
Which versions of ElasticSearch, kibana maybe logstash and browser do you Cdlt, 2014-01-29 Rashid Khan [email protected]
|
|
I just changed elasticsearch link in config.js thats it ..i am using a amazon linux instance so i just mentioned this "http://REDACTED(rashidkpc):9200" so as here to point for elasticsearch. The versions are as follows: |
|
You definitely have a syntax error in config.js, line 21, according to the screenshot you posted. Also, you absolutely should not expose port 9200 to the internet. |
|
hey it worked now... i installed the latest kibana version again. and everything worked fine |
|
just simply use a comma behind the IP like this. |

Hi all ,
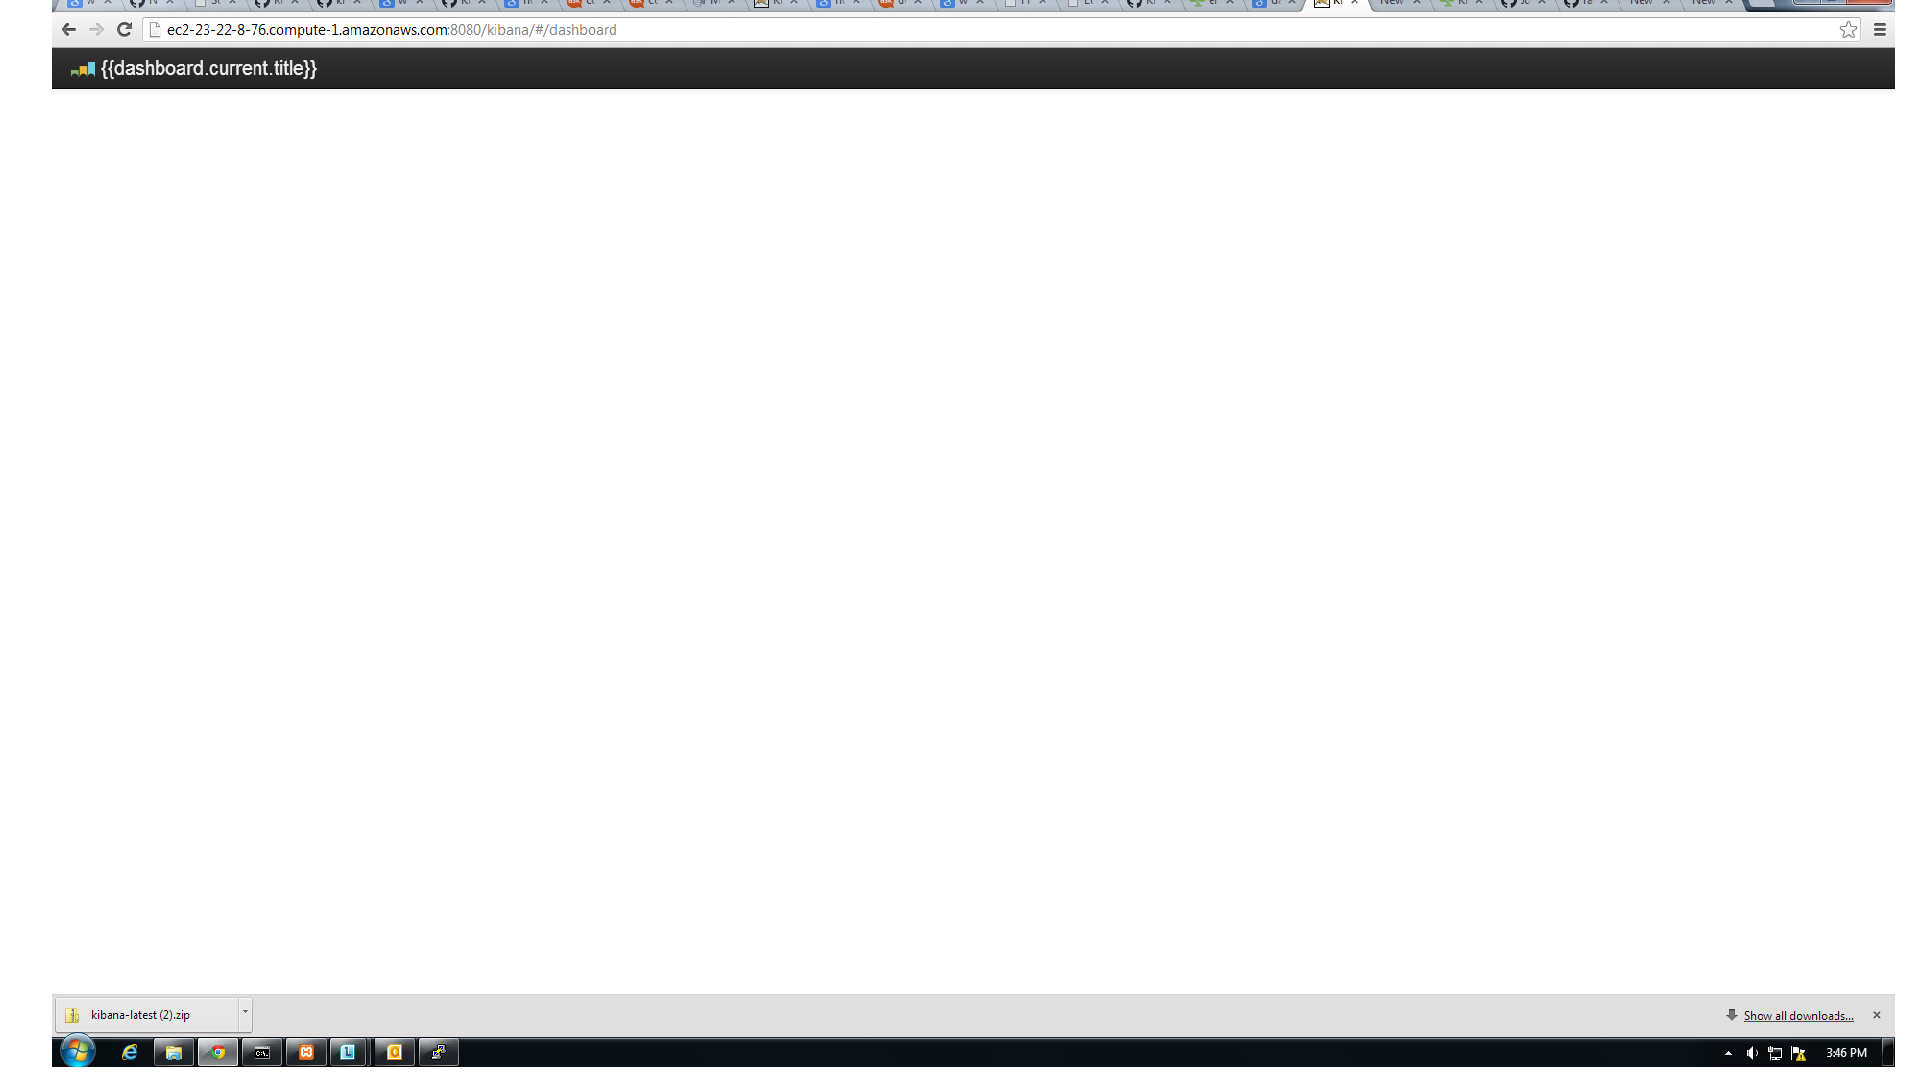
I have a amazon linux server instance and i have installed tomcat on that and i have downloaded kibana on that i have copied it in webapps folder of tomcat,everything worked fine like that on my windows machine ... but here when i access kibana from browser its doesnot display the dash board it just display this
{{dashboard.current.title}} thats it.Please help .. i have tried downloading kibana using many wget links from various websites using github ,elasticsearch but nothing seems to work.
this is the screenshot of what i get while accesing kibana.
kibana

The text was updated successfully, but these errors were encountered: