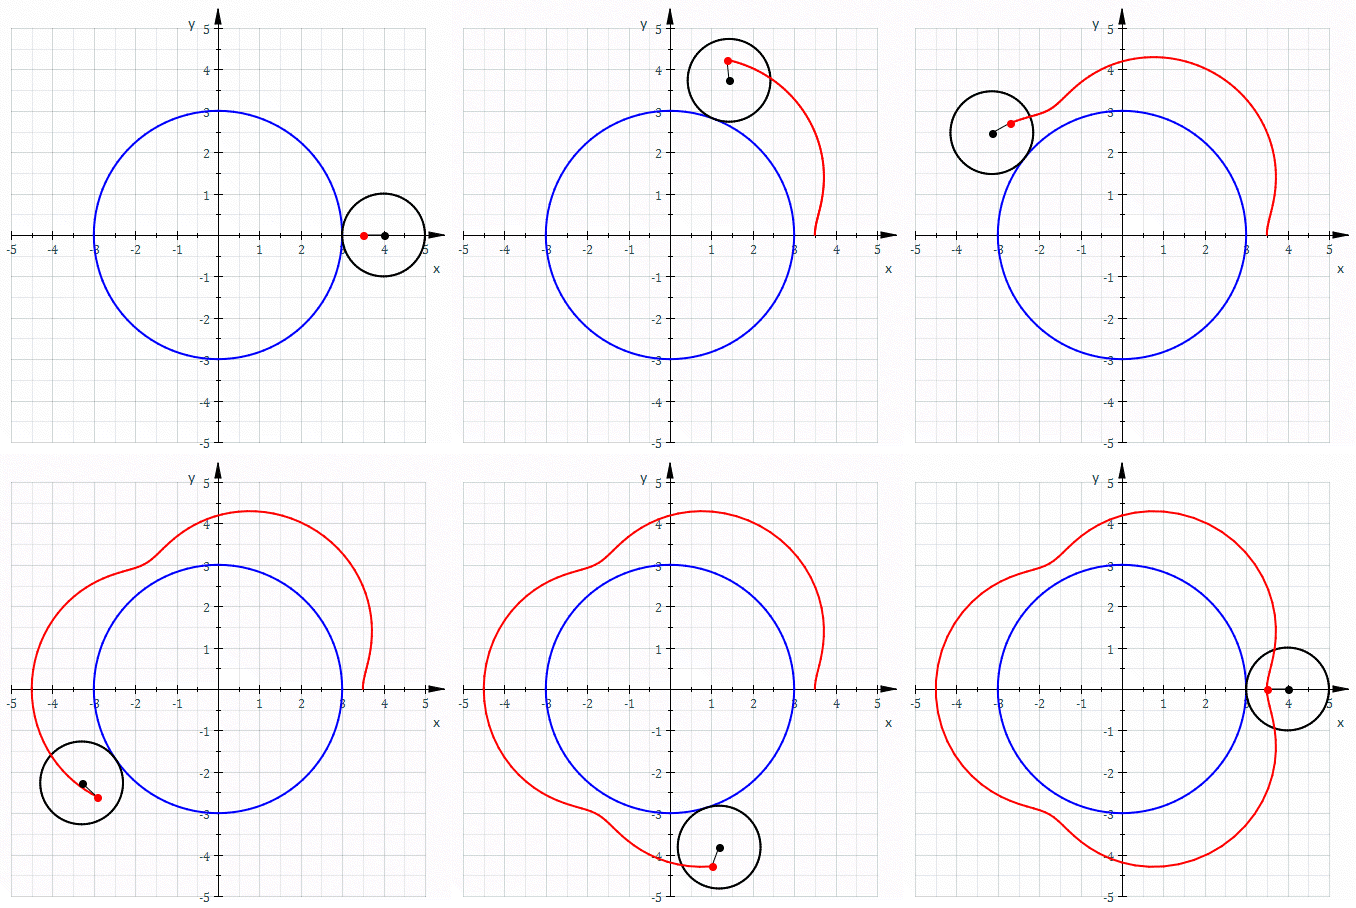
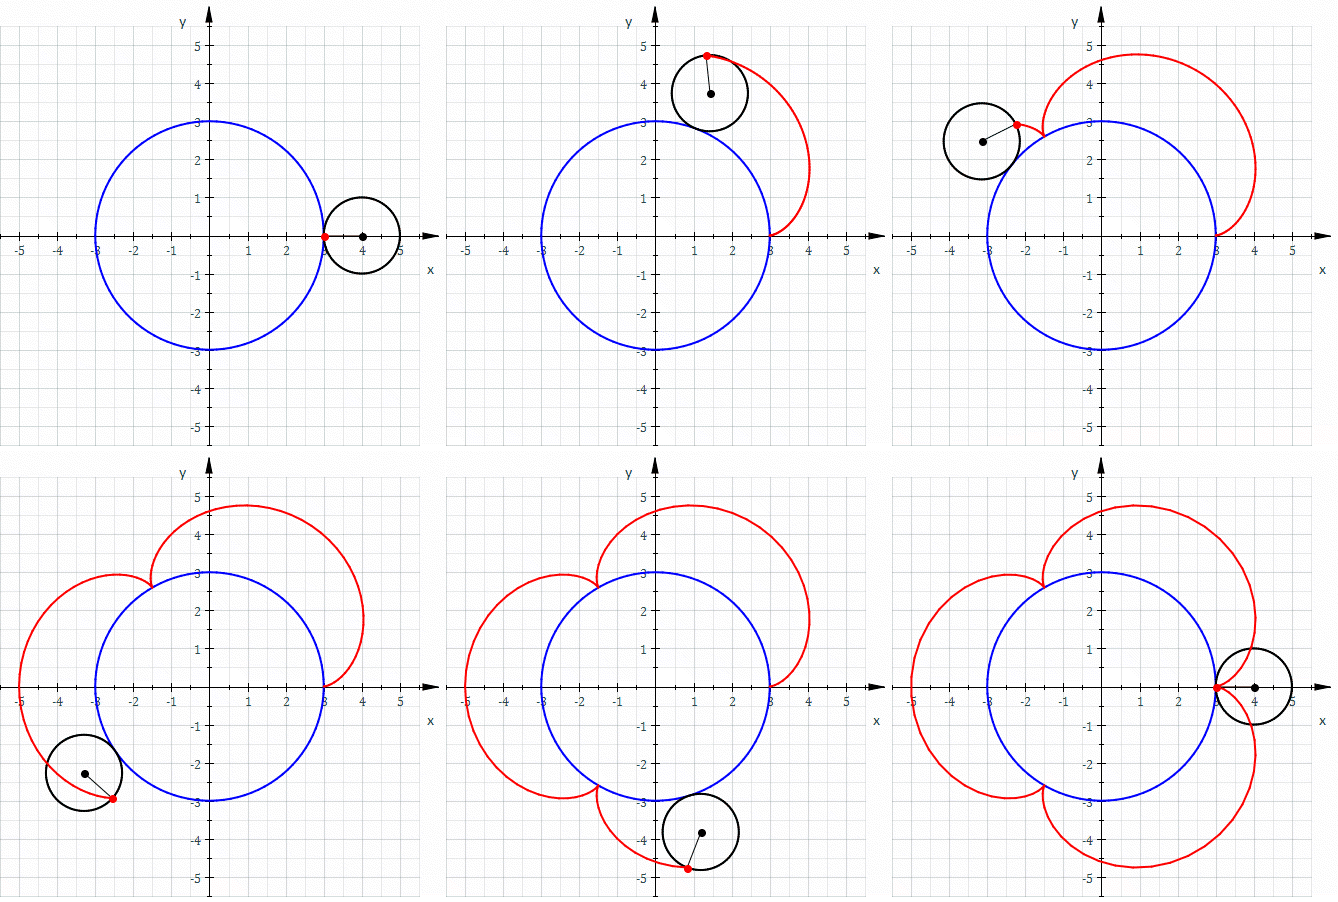
This extension will assist you creating spirograph plots in Inkscape.
The main features of this extension are
- Hypocycloid, Epicycloid, Hypotrochoid, Epitrochoid plots
- Export the svg step by step of the plot to facilitate creating animations
Compatibility table
| Inkscape | Spirograph | inkscapeMadeEasy | Receive updates? |
|---|---|---|---|
| 1.0 | 1.0 (latest) | 1.0 (latest) | YES |
| 0.48, 0.91, 0.92 | - | - | - |
Latest version: The latest version of Spirograph is 1.0. This version is compatible with Inkscape 1.0 and up only. It is incompatible with older Inkscape versions!
Installation procedures for latest versions is described below.
- You will need inkscapeMadeEasy plugin installed. Check the compatibility table above to know the version you need.
Spirograph was developed using Inkscape 1.0 in Linux (Kubuntu 18.04). It should work in different OSs too as long as all requirements are met.
-
Install inkscapeMadeEasy, version 1.0 (latest). Follow the instructions in the manual page. Note: LaTeX text is not used in this extension.
-
Spirograph installation
-
Go to Inkscape's extension directory with a file browser. Your inkscape extension directory can be accessed by opening Inkscape and selecting
Edit > Preferences > System. Look for the item User Extensions field. There is a button on the right of the field that will open a file explorer window in that specific folder. -
Create a subfolder in the extension directory with the name
spirograph. Important: Be careful with upper and lower case letters. You must write as presented above. -
Download Spirograph files and place them inside the directory you just created.
You don't have to copy all files from Github. The files you will need are inside the
latestfolder. In the end you must have the following files and directories in your Inkscape extension directory.LaTeX users: You can add macros to
inkscapeMadeEasy/basicLatexPackages.tex. The same macros will be accessible by all plugins that employ inkscapeMadeEasy.inkscape ┣━━extensions ┋ ┣━━ inkscapeMadeEasy <-- inkscapeMadeEasy folder ┃ ┣━━ inkscapeMadeEasy_Base.py ┃ ┣━━ inkscapeMadeEasy_Draw.py ┃ ┣━━ inkscapeMadeEasy_Plot.py ┃ ┗━━ basicLatexPackages.tex ┃ ┣━━ textext <-- texText folder (if you installed textText) ┃ ┋ ┃ ┣━━ spirograph <-- Spirograph folder ┋ ┣━━ spirograph.inx ┗━━ spirograph.py NOTE: You might have other sub folders inside the extensions directory. They don't interfere with the plugin.
-
Spirographs are famous toys capable of creating roulette curves on a piece of paper, called Hypotrochoid and Epitrochoid. This inkscape extension allows the creating of these families of curves.
They are constructed by a point attached to a circle of radius r rolling around the outside (Epitrochoid) or inside (Hypotrochoid) of a fixed circle of radius R, where the point is at a distance d from the center of the exterior circle.
Epitrochoid | Hypotrochoid
The special case when d=r, we have the Epi/Hypocycloid
Epicycloid | Hypocycloid
The equations that describe the curves are presented in the figure below. They are written in terms of a complex variable ( x=Re(z) and y=Im(z) )
In order to close the curve (if possible), it is necessary N turns over the circle R, given by
where lcm(r,R) is the least common multiple between r and R.
Curve type: You can choose Epitrochoid or Hypotrochoid.
Fixed circle radius (R): Radius of the fixed circle. See Equations section.
Rolling circle radius (r): Radius of the moving circle. See Equations section.
Pencil distance(d): Distance between the position of the pencil and the center of the rolling circle. See Equations section. Use d=r to get Epicycloid or Hypocycloid.
Detail level: Defines the number of points used to trace the curve.
Draw base circles: Add the two circles in the initial position. See figure above.
Animate: export a sequence of svg for animation purposes. See Bash script to create the animations one option Linux only) to create the animation after exporting the SVGs. The code has limited animation features. When activated, the plot will show the circle rolling and 3 curves plotted at the same time as one animation example. See Examples section for the result. Unfortunately, if you want to create different animations, you will need to change the source code yourself. Hopefully the code is understandable for those with some python knowledge.
Animation directory: Folder where the exported svgs will be stored.
This is the script I use to create the animation. This is exclusive for Linux. Similiar script could be created for other OSs. You will need pdfcrop, ImageMagick to use the script. See Examples section for one example
#! /bin/bash

#requires the follogins packages:  pdfcrop, imagemagick


rm tempSizes.txt

if [ $# -lt 1 ]
  then
  echo "Wrong number of arguments.
 svg2gif <file1.svg> <file2.svg> ..."
  exit
fi

FILE_DIR=$(dirname $1)


echo "converting to pdf and finding the bounding box..."
for FILE in "$@"; do
  if [ ${FILE: -4} == ".svg" ]; then
    FILE_PREFIX=$(basename $FILE .svg)
    FILE_DIR=$(dirname $FILE)
    FILE_PDF=${FILE_DIR}'/'${FILE_PREFIX}.pdf

    inkscape --vacuum-defs --export-type="pdf" $FILE   # export para eps

    # encontra o bounding box e salva em um arquivo de texto
    # source: https://tex.stackexchange.com/questions/166758/how-do-i-make-pdfcrop-output-all-pages-of-the-same-size
    pdfcrop --verbose $FILE_PDF temp.pdf| grep '^%%HiResBoundingBox: ' | cut -d' ' -f2- >>tempSizes.txt
    rm temp.pdf
  fi
done

# source: https://tex.stackexchange.com/questions/166758/how-do-i-make-pdfcrop-output-all-pages-of-the-same-size
#find bounding box of all images
BBOX=$(less tempSizes.txt | tr '.' ',' | datamash -t' ' min 1 min 2 max 3 max 4 | tr ',' '.')
rm tempSizes.txt

echo "cropping PDFs..."
#crop pdfs and convert to png
for FILE in "$@"; do
  if [ ${FILE: -4} == ".svg" ]; then
    FILE_PREFIX=$(basename $FILE .svg)
    FILE_DIR=$(dirname $FILE)
    FILE_PDF=${FILE_DIR}'/'${FILE_PREFIX}.pdf
    pdfcrop --bbox "$BBOX" $FILE_PDF
  fi
done

echo "converting to PNG..."
mogrify -density 500 -resize 800 -flatten -format png ${FILE_DIR}/out*-crop.pdf
echo "gerando GIF..."
convert -delay 5 -dispose previous -loop 0  ${FILE_DIR}/outSVG_*.png  ${FILE_DIR}/animated.gif
rm outSVG*.pdf outSVG*.png
- The axes will be created in the center of your screen.
The image below is an animation composed by 3 simultaneous curves, converted to gif (external tools).


