The goal of this project is to retrieve temperature, humidity and battery level from Xiamo Mijia LYWSD03MMC bluetooth sensors, and to visualize them with a Grafana server.
This project needs:
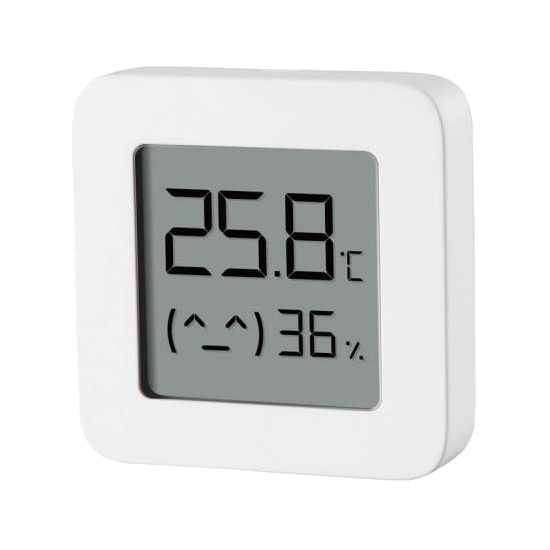
- one or more LYWSD03MMC sensors;
- a relay server with a bluetooth adapter running on Linux (e.g. a Raspberry Pi with a Bluetooth dongle);
- a backend server hosting the InfluxDB and Grafana server (this can be the same as the relay server).
- Input None
- Output Bluetooth advertisements conveying weather data
Read carefully and follow the instructions of pvvx to flash the custom software on the sensors. Choose the custom format advertising format.
Here is a quick link to the OTA webpage. It may work better on a smartphone.
- Input Bluetooth advertisements conveying weather data
- Output Queries run to insert data in an InfluxDB server
The purpose of the relay component is to take as input the BLE advertisements of the sensors, to decode them, and to forward them to an InfluxDB time series server. This repository contains the rust code to generate this relay component.
You can either build it directly on the relay server, or locally (but this might need a cross-compiling setup).
A Dockerfile is also available that builds the application for:
- a standard modern linux system;
- a Raspberry Pi.
docker build --tag lywsd03mmc2influx .
docker create --name=lywsd03mmc2influx lywsd03mmc2influx
docker cp lywsd03mmc2influx:/lywsd03mmc2influx.x86_64 /tmp
docker cp lywsd03mmc2influx:/lywsd03mmc2influx.armhf /tmp
The cross-compilation toolchain used can be found here. You can modify the Dockerfile to use another toolchain.
On Debian, the application needs the package bluetooth, which should also install bluez and dbus (to verify on a fresh install).
After the build, you can read the help with the --help cli flag. The names
mapping has two purposes:
- filter the advertisements: the bluetooth communication is based on RF broadcasting, so one must be able to filter out messages from non relevant devices in the vicinity of the receiver;
- associate a friendly name to a sensor, rather than its mac address.
The format of the mapping is a csv (either in a file, or piped in stdin) without headers, one row per sensor, with two fields:
<mac address 1>,<Friendly name 1>
<mac address 2>,<Friendly name 2>
...
for instance
A4:C1:38:DD:EE:FF,Living room
A4:C1:38:AA:BB:CC,Bedroom
- copy the generated binary on your target at
/usr/local/bin/lywsd03mmc2influx - create the csv mapping file at
/etc/lywsd03mmc2influx_mapping.csv - copy the systemd unit file found in the resources
folder of the repository to
/etc/systemd/system/lywsd03mmc2influx.service - reload systemd, enable and start the service (InfluxDB needs to be installed first):
systemctl daemon-reload
systemctl enable lywsd03mmc2influx.service
systemctl start lywsd03mmc2influx.service
- Input Queries inserting weather data
- Ouput Stored weather data
InfluxDB is a database management system specialized in time series. To install it, please refer to the documentation.
Once installed:
- connect to the DBMS:
influx - create a database:
CREATE DATABASE weather_data. The name must match the one given in the relay component (either as default or as a cli argument).
Consider setting up on automated downsampling of the data to fluidify the task of data visualization.
For an InfluxDB v1.8:
USE weather_data

CREATE RETENTION POLICY "half_day" ON "weather_data" DURATION 12h REPLICATION 1 DEFAULT
CREATE RETENTION POLICY "five_year" ON "weather_data" DURATION 260w REPLICATION 1

CREATE CONTINUOUS QUERY "cq_5m" ON "weather_data"
RESAMPLE EVERY 1m
BEGIN
  SELECT
    mean("temperature") AS "temperature",
    mean("humidity") AS "humidity",
    mean("battery_level") as "battery_level",
    mean("battery_voltage") as "battery_voltage"
  INTO "five_year"."weather_meas_ds"
  FROM "weather_meas"
  GROUP BY time(5m), sensor, room
END
You may need to activate continuous queries in the dedicated section
of the configuration file, /etc/influxdb/influxdb.conf.
- Input Stored weather data
- Ouput Visualization
Please refer to the documentation:
Query examples for your panels, assuming you use weather_meas as measurement name:
SELECT mean("temperature") FROM "weather_meas" WHERE $timeFilter GROUP BY room, time($__interval)
SELECT mean("humidity") FROM "weather_meas" WHERE $timeFilter GROUP BY room, time($__interval)`
SELECT mean("battery_voltage") FROM "weather_meas" WHERE $timeFilter GROUP BY room, time($__interval)`
Don't forget to replace "weather_meas" with "five_year"."weather_meas_ds" if you use downsampled data.
Argument in favour of a smaller period (more samples):
- more accurate readings of the data;
- if you target a specific sample rate, and if the bluetooth connection is not so good, you're more likely not to have holes in your data with an oversampled advertising period.
Argument in favour of a bigger period (fewer samples):
- an increased battery life of the sensors (cf. the small study);
- a smaller computational burden (for instance data retrieval and aggregation), all the more if your server is not so powerful (like a Rasperry Pi).