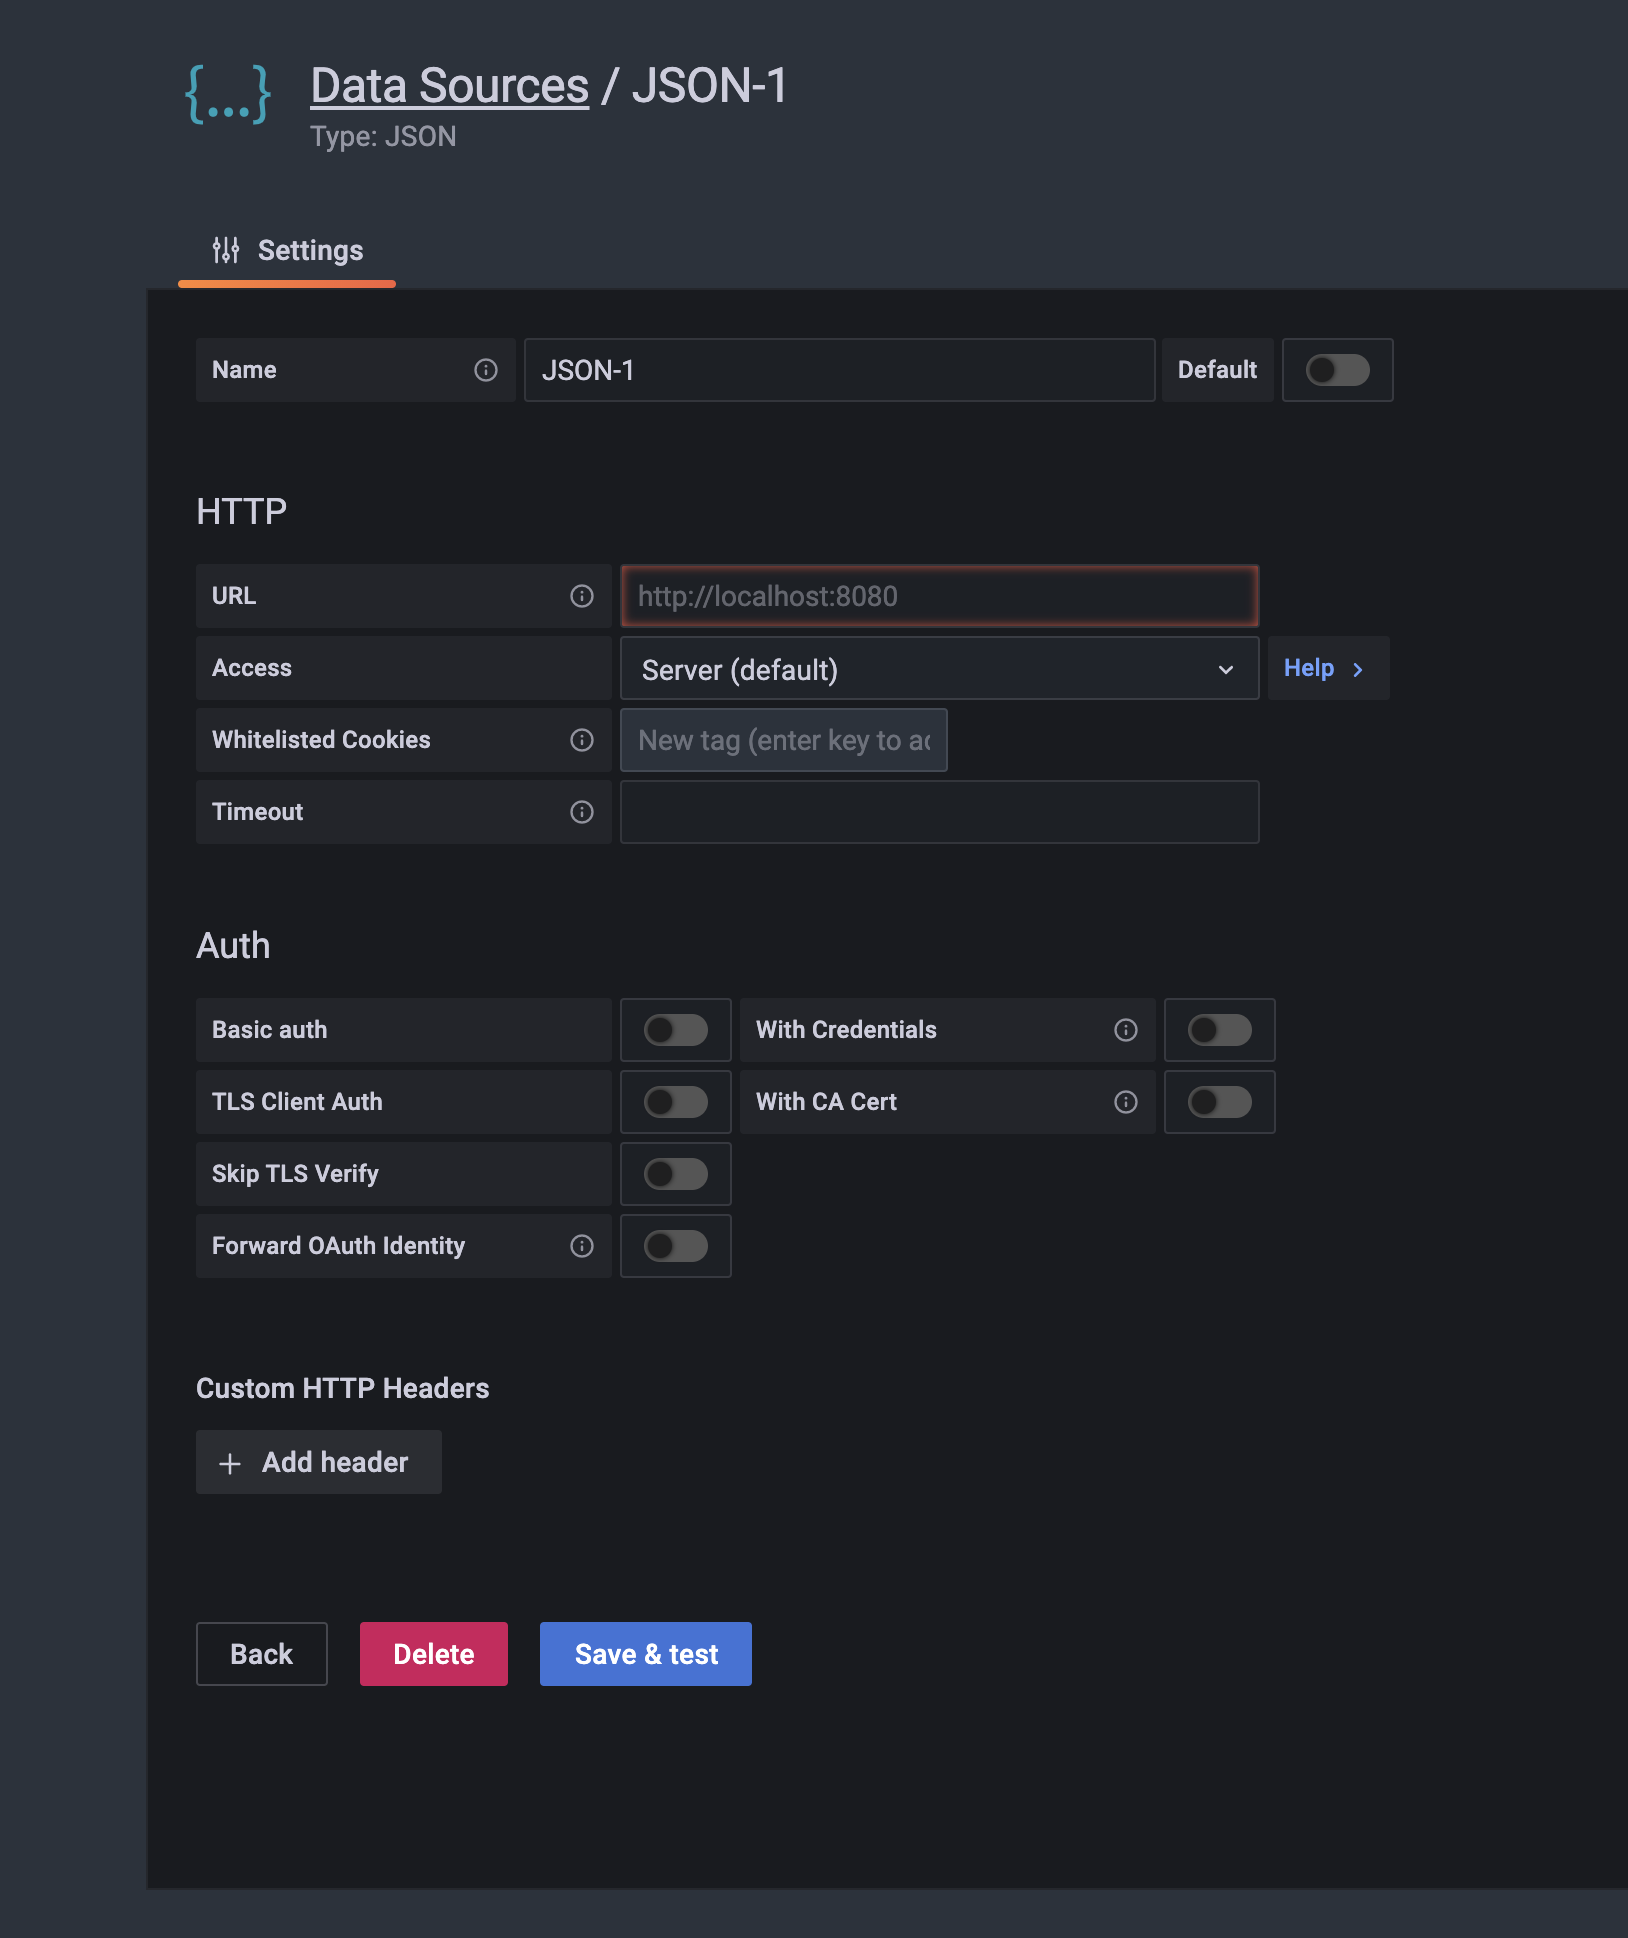
The JSON Datasource executes requests against IBM TNCP HTTP backend and parses JSON response into Grafana dataframes.
To install this plugin using the grafana-cli tool:
grafana-cli plugins install persistentsystems-ibmtncp-datasourceSee here for more information.
When adding datasource add your API endpoint to the URL field. That's where datasource will make requests to.
If you want to add custom headers, keep Access set to Server.
An OpenAPI definition is defined at openapi.yaml.
To work with this datasource the backend needs to implement 4 endpoints:
GET /with 200 status code response. Used for "Test connection" on the datasource config page.POST /searchto return available resources.POST /queryto return panel data or annotations.POST /resourceTypesto return list of resources.POST /metricsto return list of metrics.
Those two urls are optional:
POST /tag-keysreturning tag keys for ad hoc filters.POST /tag-valuesreturning tag values for ad hoc filters.
type of request : POST Returns list of resources satisfying condition mentioned inside variables editor. Used by the find metric options on the query tab in panels & in variables editor.
examples of request JSON Object: 1){target:SELECT resource.type} 2){"target":"SELECT resource.id WHERE resource.type == 'Market'"}
examples of resposne JSON Object: 1)["Market","Region","device","deviceGtm","deviceLtm"] 2)["Global","North East","South Central"]
type of request : POST Grafana issues this request while returning metric data for selected filters example of request JSON Object: {"app":"dashboard","requestId":"Q105","timezone":"browser","panelId":2,"dashboardId":36,"range":{"from":"2022-02-03T18:30:00.000Z","to":"2022-02-05T18:29:59.000Z","raw":{"from":"2022-02-03T18:30:00.000Z","to":"2022-02-05T18:29:59.000Z"}},"timeInfo":"","interval":"5m","intervalMs":300000,"targets":[{"payload":"","refId":"A","target":"interface!Network.Outbound.Packets.Count","datasource":"ITNCP-AUTH"}],"maxDataPoints":400,"scopedVars":{"__interval":{"text":"5m","value":"5m"},"__interval_ms":{"text":"300000","value":300000}},"startTime":1645265383171,"rangeRaw":{"from":"2022-02-03T18:30:00.000Z","to":"2022-02-05T18:29:59.000Z"},"adhocFilters":[]}
example of resposne JSON Object: example of resposne JSON Object : [{"target":"10.55.239.138_interface:<260>","datapoints":[[0.0,1643913000000],[0.0,1643914800000],[0.0,1643916600000],[0.0,1643918400000],[0.0,1643920200000]]},{"target":"10.55.239.31_interface:<4>","datapoints":[[0.0,1643913000000],[0.0,1643914800000],[0.0,1643916600000],[0.0,1643918400000],[0.0,1643920200000]]},{"target":"10.55.239.138_interface:<227>","datapoints":[[0.0,1643913000000],[0.0,1643914800000],[0.0,1643916600000],[0.0,1643918400000],[0.0,1643920200000]]},{"target":"10.55.239.235_interface:<20>","datapoints":[[5.0,1643913000000],[5.0,1643914800000],[5.0,1643916600000],[5.0,1643918400000],[5.0,1643920200000]]}
Sending additional data for each metric is supported via the Payload input field that allows you to enter any JSON string.
For example, when {"format":"table", "tags":"NFType,DataCenter,Market"} is entered into Payload input, it is attached to the target data under "payload" key:
"targets":[{"refId":"A","payload":{"format":"table","tags":"NFType,DataCenter,Market"},"target":"interface","datasource":"IBM-TNCP"}]type of request : POST Grafana issues this request while populating ad-hoc filter key example of request JSON Object: No Payload for request example of resposne JSON Object: [{"type":"string","text":"DataCenter"},{"type":"string","text":"Domain"},{"type":"string","text":"Market"},{"type":"string","text":"NFName"},{"type":"string","text":"NFType"},{"type":"string","text":"Region"},{"type":"string","text":"Vendor"},{"type":"string","text":"displayName"},{"type":"string","text":"id"},{"type":"string","text":"siteId"},{"type":"string","text":"type"},{"type":"string","text":"vDU"}]
type of request : POST Grafana issues this request while populating ad-hoc filter values example of request JSON Object: No Payload for request example of resposne JSON Object: [{"text":"None"},{"text":"batonrougeSAP"},{"text":"schertzSAP"},{"text":"undefined"},{"text":"westboroughSAP"},{"text":"wilmingtonSAP"},{"text":"windsorSAP"}]
type of request : POST Grafana issues this request on 1)Creation of new dashboard 2)Updation of existing dashboard example of request JSON Object: {"target":""} example of resposne JSON Object: ["ALL","AMF","APN","CHF","DNN","DU","Domain","GNB","Market","NRF"]
type of request : POST Grafana issues this request on 1)Creation of new dashboard 2)Updation of existing dashboard example of request JSON Object: {"target":""} example of resposne JSON Object: ["CPU.Interrupt.Utilization.Percent","CPU.Utilization.Percent","Common.CPU.Utilization.Percent","Common.Current.Connections.Client.Side","Common.Current.Connections.Server.Side","Common.Inbound.Throughput.Client.Side.bps"]
Use of Yarn is encouraged to build.
yarn install
yarn run build