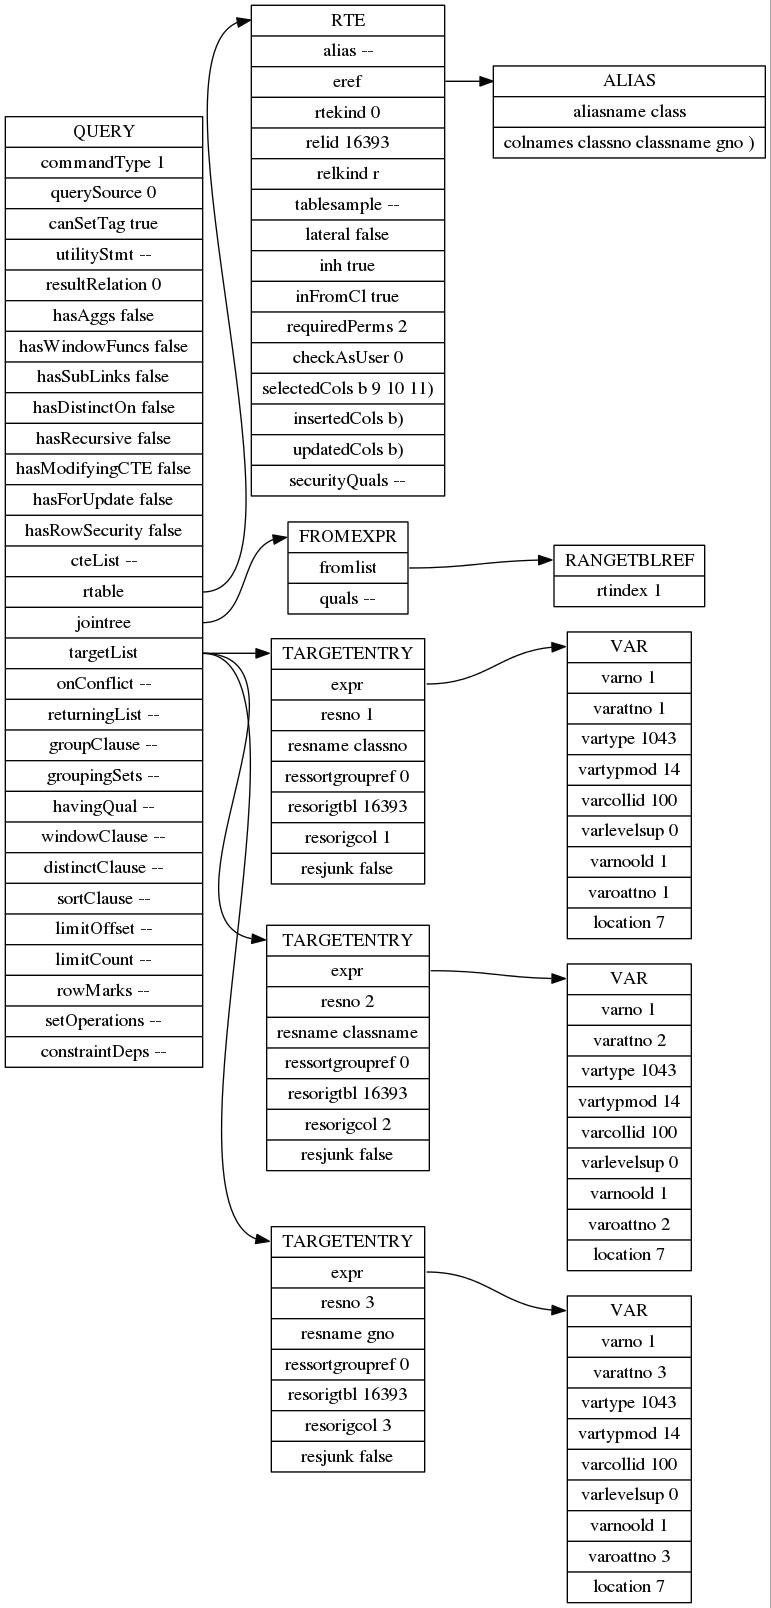
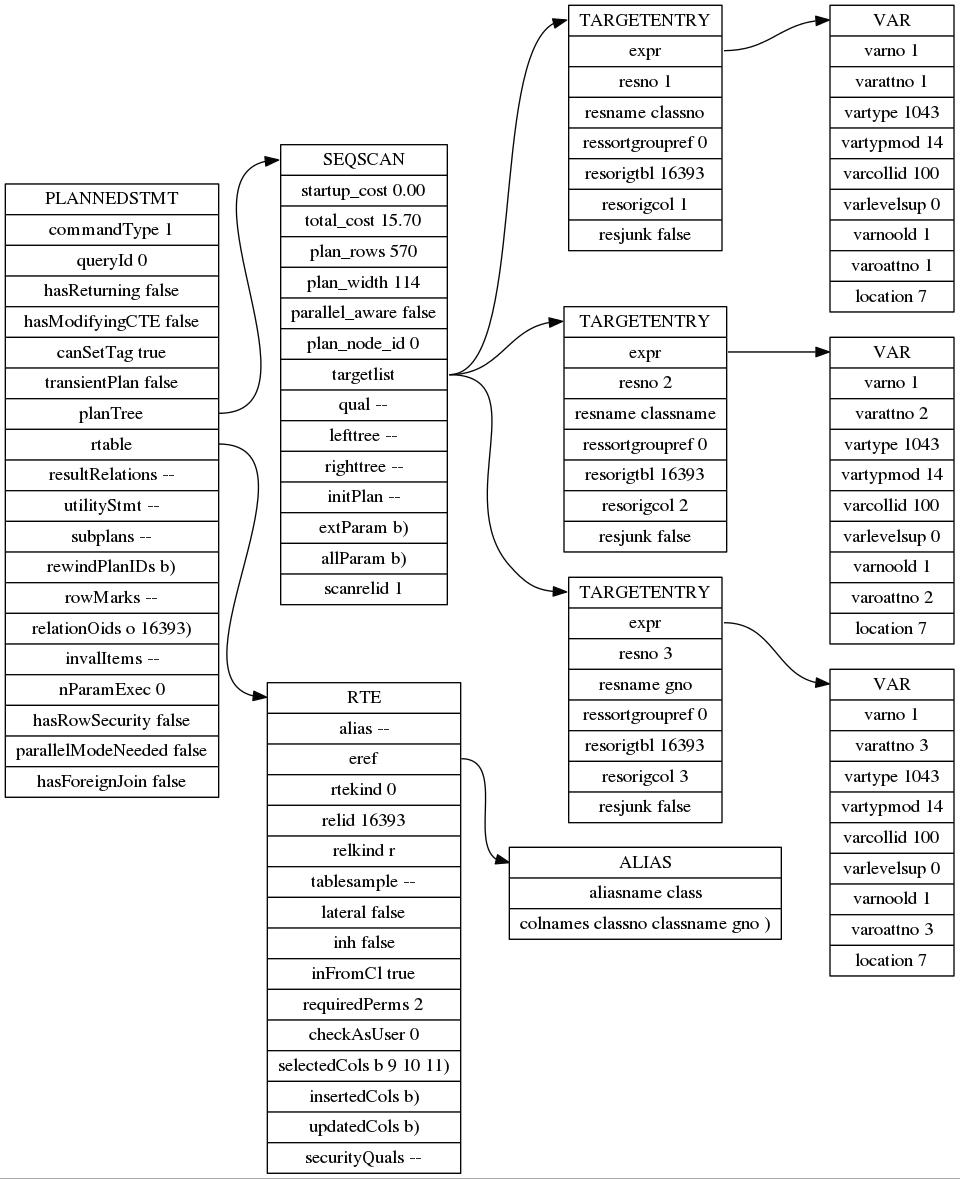
The output of postgreSQL node tree can be very long for the developer to investigate. pgNodeGraph tool can covert the output of the node tree into jpg formatted pictiure which is quite convenient for developing or debugging purposess.
suppose we have a table like this
postgres=# \d class
             Table "public.class"
  Column   |         Type          | Modifiers
-----------+-----------------------+-----------
 classno   | character varying(10) |
 classname | character varying(10) |
 gno       | character varying(10) |
by turning the following option on, the postgreSQL will print the node tree after parse and plan the query.
set debug_print_parse = on;
set debug_print_plan = on;
set debug_pretty_print = on;
now let's execute a statment.
postgres=# select * from class;
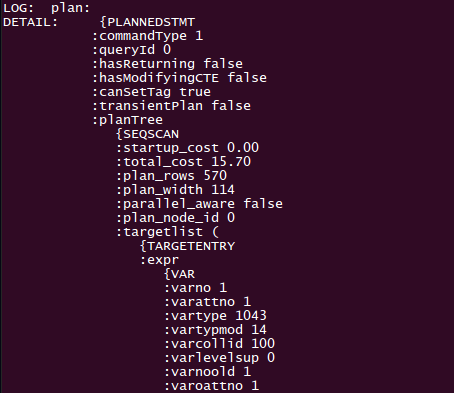
the sever will print the parse and plan node tree in the log. according to different type of queries, the out put usually last for hundred or thousand lines. below is an example.
the node tree printed by of postgreSQL, as you have seen is hard for the developer or user to see it as a whole. so, is there a way to print the node tree as a picture format? the answer is yes. now, let me show you how to use pgNodeGraph to convert the node tree to a picture format.
- copy and paste the node tree in text form.
- put it in node dir
- run
$ ./pgNodeGraph
$ ./pgNodeGraph
processing file sample.node ...done
after a short wait, the node tree in jpg format is generated under the pic directory.
Now, let's try a much more complex query to see whether pgNodeGraph will work well.
select classno, classname, avg(score)::numeric(5,1) as 平均分
from   sc, (select * from class where class.gno='一年级') as sub
where
 sc.sno in (select sno from student where student.classno=sub.classno)
 and
 sc.cno in (select course.cno from course where course.cname='数学')
group by classno, classname
having avg(score)>60
order by 平均分 desc;
following the same procedure in above, we generate the result as below.
QueryNodeTree:

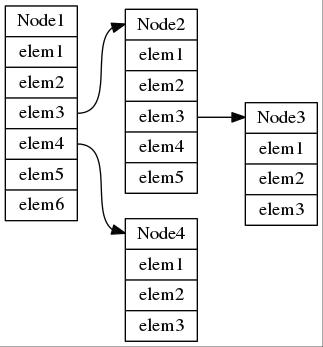
pgNodeGraph tool first convert the node tree printed by postgreSQL to dot format.
the node tree:
{Node1
 :elem1
 :elem2
 :elem3
 {Node2
  :elem1
  :elem2
  :elem3
  {Node3
   :elem1
   :elem2
   :elem3
  }
  :elem4
  :elem5
 }
 :elem4
 {Node4
   :elem1
   :elem2
   :elem3
 }
 :elem5
 :elem6
}
the corresponding dot format:
digraph Query {
size="100000,100000";
rankdir=LR;
node [shape=record];
node1 [shape=record, label="<f0> Node1 | <f1> elem1 | <f2> elem2 | <f3> elem3 | <f4> elem4 | <f5> elem5 | <f6> elem6 "];
node2 [shape=record, label="<f0> Node2 | <f1> elem1 | <f2> elem2 | <f3> elem3 | <f4> elem4 | <f5> elem5 "];
node3 [shape=record, label="<f0> Node3 | <f1> elem1 | <f2> elem2 | <f3> elem3 "];
node4 [shape=record, label="<f0> Node4 | <f1> elem1 | <f2> elem2 | <f3> elem3 "];
node1:f3 -> node2:f0
node1:f4 -> node4:f0
node2:f3 -> node3:f0

}
the by using the dot tool to genereate the picture.
so, you must have dot or graphvis tool installed on your system.


