-
Test with
wrk -c400 -t12 -d4m http://localhost:[PORT]/ -
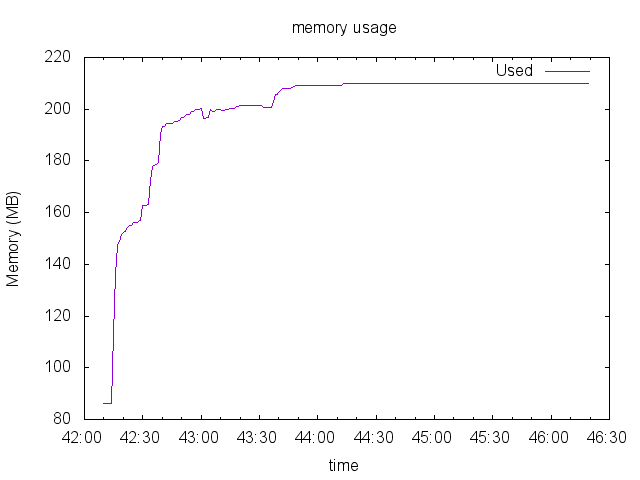
Collect data with
node memorypid.js [PID] [name].csv -
Generate graph with
bash tograph.sh [file].csv(this is using gnuplot)
var http = require('http')

var srv = http.createServer(function (req, res) {
  res.writeHead(200, {'Content-Type': 'text/plain'});
  return res.end('okay');
});

srv.listen(8889, '127.0.0.1', function() {
  console.log(process.pid + ' listening on 8889')
})
Running 4m test @ http://localhost:8889
  12 threads and 400 connections
  Thread Stats   Avg      Stdev     Max   +/- Stdev
    Latency    20.66ms    4.00ms 719.74ms   98.63%
    Req/Sec     1.61k   164.35     5.34k    89.63%
  4597543 requests in 4.00m, 648.91MB read
Requests/sec:  19152.29
Transfer/sec:      2.70MB
Running 4m test @ http://localhost:8889/
  12 threads and 400 connections
  Thread Stats   Avg      Stdev     Max   +/- Stdev
    Latency    22.62ms    3.56ms 263.81ms   91.11%
    Req/Sec     1.46k   193.23     3.19k    88.26%
  4198341 requests in 4.00m, 592.57MB read
Requests/sec:  17486.58
Transfer/sec:      2.47MB

Running 4m test @ http://localhost:8889/
  12 threads and 400 connections
  Thread Stats   Avg      Stdev     Max   +/- Stdev
    Latency    26.40ms   10.13ms 839.32ms   90.94%
    Req/Sec     1.26k   188.60     7.19k    87.87%
  3619514 requests in 4.00m, 510.87MB read
Requests/sec:  15076.75
Transfer/sec:      2.13MB

var express = require('express')
var app = express()
var os = require('os')

app.get('/', function(req, res, next) {
  return res.end()
})

console.log(process.pid)

app.listen(8888)
Running 4m test @ http://localhost:8888
  12 threads and 400 connections
  Thread Stats   Avg      Stdev     Max   +/- Stdev
    Latency    25.19ms    2.18ms 249.77ms   91.04%
    Req/Sec     1.31k   138.16     4.33k    90.37%
  3754626 requests in 4.00m, 486.97MB read
Requests/sec:  15640.64
Transfer/sec:      2.03MB
Running 4m test @ http://localhost:8888/
  12 threads and 400 connections
  Thread Stats   Avg      Stdev     Max   +/- Stdev
    Latency    27.21ms    4.26ms 280.73ms   92.54%
    Req/Sec     1.22k   141.41     3.27k    82.33%
  3489596 requests in 4.00m, 452.60MB read
Requests/sec:  14534.20
Transfer/sec:      1.89MB

Running 4m test @ http://localhost:8888/
  12 threads and 400 connections
  Thread Stats   Avg      Stdev     Max   +/- Stdev
    Latency    34.50ms   40.16ms   2.00s    99.67%
    Req/Sec     1.01k   136.45     3.30k    76.55%
  2888506 requests in 4.00m, 374.64MB read
Requests/sec:  12031.85
Transfer/sec:      1.56MB

Use sails new sometest && cd sometest && sails lift, get pid and collect data.

Running 4m test @ http://localhost:1337
  12 threads and 400 connections
  Thread Stats   Avg      Stdev     Max   +/- Stdev
    Latency   657.31ms  170.23ms   1.92s    88.50%
    Req/Sec    53.02     34.70   323.00     91.55%
  144389 requests in 4.00m, 1.53GB read
Requests/sec:    601.40
Transfer/sec:      6.52MB
Running 4m test @ http://localhost:1337/
  12 threads and 400 connections
  Thread Stats   Avg      Stdev     Max   +/- Stdev
    Latency   749.13ms  180.14ms   1.98s    89.04%
    Req/Sec    46.81     28.79   323.00     95.49%
  126984 requests in 4.00m, 1.34GB read
  Socket errors: connect 0, read 0, write 0, timeout 18
Requests/sec:    528.88
Transfer/sec:      5.73MB

Running 4m test @ http://localhost:1337/
  12 threads and 400 connections
  Thread Stats   Avg      Stdev     Max   +/- Stdev
    Latency   827.37ms  186.11ms   2.00s    81.78%
    Req/Sec    54.56     41.40   333.00     78.87%
  108245 requests in 4.00m, 1.15GB read
  Socket errors: connect 0, read 0, write 0, timeout 353
Requests/sec:    450.84
Transfer/sec:      4.88MB

//.sailsrc
"hooks": {
  "session": false
}
//config/http.js

module.exports.http = {
  middleware: {
    order: [
      'startRequestTimer',
      'cookieParser',
      // 'session',
      'myRequestLogger',
      'bodyParser',
      'handleBodyParserError',
      'compress',
      'methodOverride',
      'poweredBy',
      '$custom',
      'router',
      'www',
      'favicon',
      '404',
      '500'
    ],
  },
}
> Intel(R) Core(TM) i5-4670K CPU @ 3.40GHz
> 16gb mem
> ssd

Running 4m test @ http://localhost:1337/
  12 threads and 400 connections

  Thread Stats   Avg      Stdev     Max   +/- Stdev
    Latency   402.79ms   36.93ms 909.55ms   84.07%
    Req/Sec    88.65     73.55   323.00     71.15%
  142331 requests in 4.00m, 1.49GB read
  Socket errors: connect 157, read 87, write 7, timeout 0
Requests/sec:    592.79
Transfer/sec:      6.34MB
❯

Running 4m test @ http://localhost:8887
  12 threads and 400 connections
  Thread Stats   Avg      Stdev     Max   +/- Stdev
    Latency   107.35ms   49.70ms 344.07ms   70.62%
    Req/Sec   316.80     99.39   797.00     73.20%
  906505 requests in 4.00m, 171.21MB read
Requests/sec:   3775.56
Transfer/sec:    730.19KB
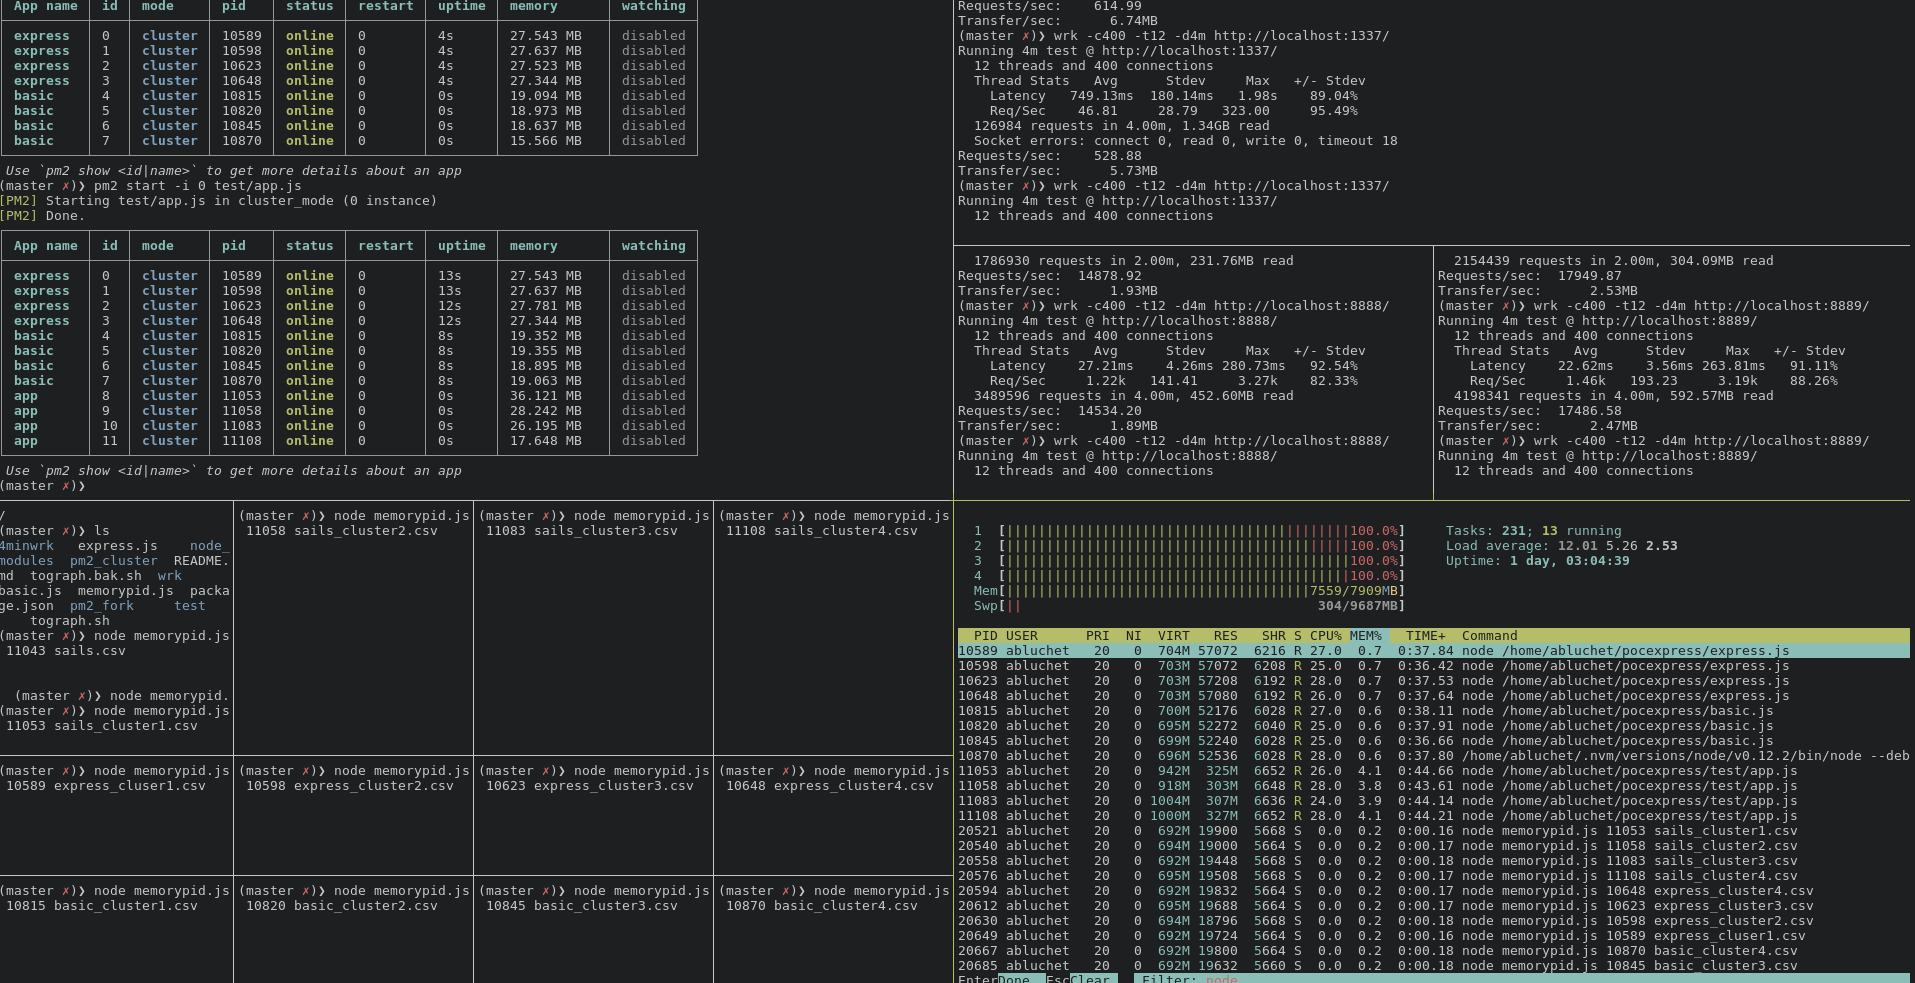
When using pm2, everything was running together, performances showed by wrk won't reflect reality! In theory the cluster mode is way more performant than the fork mode but when your cpu has no more room to treat the threads it's obviously decreasing performances.
When using the cluster for example, I had 12 node processes for 3 different web servers and CPU had a hard time (100% on each core):
Test PC:
- Intel(R) Core(TM) i5-4590 CPU @ 3.30GHz
- 8Gb total mem
- SSD