This a simple extension of ipyleaflet Map to work with Google Earth Engine images.
To use this library you need a valid Google Earth Engine account and the Python API. You can find more information at https://developers.google.com/earth-engine/python_install.
- Function to add EE layers.
- Handles Map interactions (e.g.: click) with custom functions.
For the latest development version, first get the source from github:
git clone https://github.com/spadarian/jupyter_ee_map.git
Then navigate into the local jupyter_ee_map directory and simply run:
python setup.py install
or:
python setup.py install --user
Try this example on a Jupyter notebook.
from jupyter_ee_map import EEMap
import ee
ee.Initialize()

# Load a sample Image (elevation)
dem = ee.Image('CGIAR/SRTM90_V4')
Let's create a custom function to handle clicks on the map and request the elevation value at the clicked coordinates. Note that the callback functions will receive 2 parameter: a instance of the EEMap and the coordinates ([lat, long]).
def on_click(cls, coords):
    print('Loading data (coords: ', coords, ')... ', end='')
    # Reverse the coordinates to [x, y]
    geom = ee.Geometry.Point(coords[::-1])
    # Iterate through all the EE layers.
    for l in cls.ee_layers:
        # Sample the layers at the clicked coordinates
        ans = l.reduceRegion(reducer='mean', geometry=geom, scale=100).getInfo()
        print(ans, end=' ')
    print('')
After this you just need to initialise the EEMap class:
test_map = EEMap(
    center=(48.2082, 16.3779), zoom=4,
    layout={'height':'400px'},
    events={'click': on_click}  # Note the dictionary with the event name as key
)

test_map.add_ee_layer(dem, vis={'min': 0, 'max': 2500})
test_map
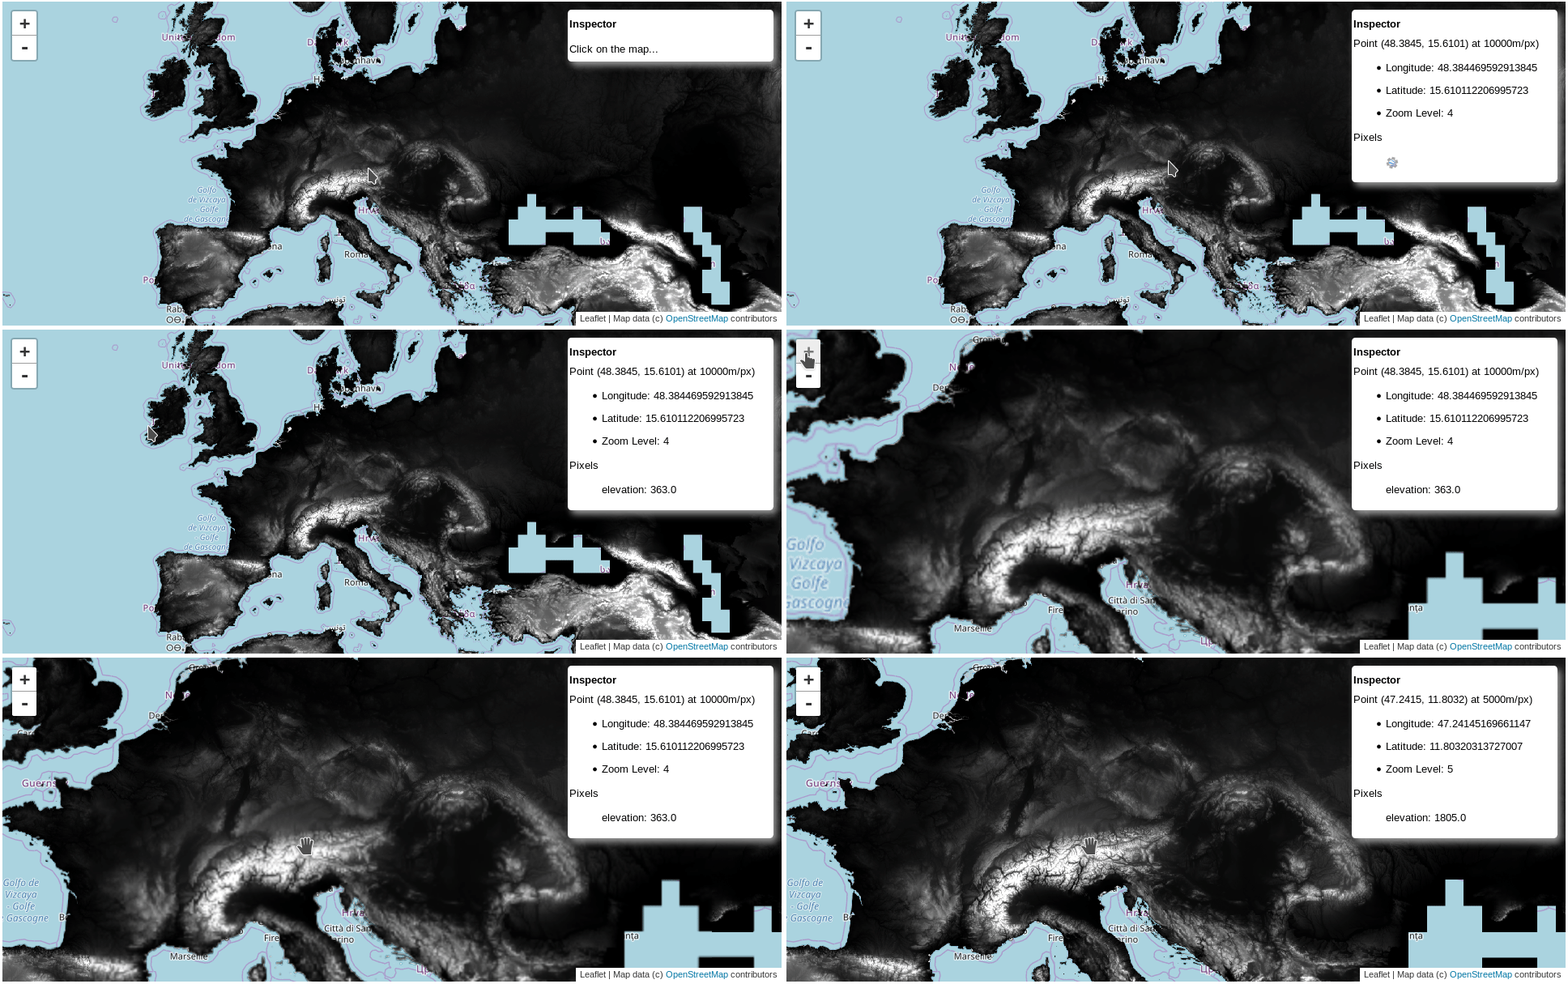
That will show a map Widget and you would be able to click on it and get the elevation values.
Try this example on a Jupyter notebook.
from jupyter_ee_map import EEMap
import ipywidgets as widgets
from ipyleaflet import WidgetControl
import ee
ee.Initialize()

# Load a sample Image (elevation)
dem = ee.Image('CGIAR/SRTM90_V4')
Let's create an empty 'inspector' WidgetControl that will be shown when we first display the map:
inspector = widgets.HTML(
    value='''
    <div style="width: 250px">
      <h5 style="font-weight:bold">Inspector</h5>
      <p>Click on the map...</p>
    </div>''',
)
inspector = WidgetControl(widget=inspector, position='topright')
Now we need custom function to handle clicks similar to the one in the first example. The function will change the content of the widget every time we click on the map. Another modification I added is a reduce scale dependent on the map zoom level.
# Approximate scales at different zoom levels
res = [157000, 78000, 39000, 20000, 10000, 5000, 2000, 1000, 611, 306,
       153, 76, 38, 19, 10, 5, 2, 1, 0.6, 0.3, 0.1, 0.0746, 0.0373]
scales = {z: r for z, r in enumerate(res)}


def widget_content(coords, zoom, scale):
    """Generate widget content similar to JS inspector"""
    img = '<li style=><img src="https://code.earthengine.google.com/images/loading.gif"/></li>'
    msg = '''
    <h5>Point ({0:.4f}, {1:.4f}) at {3}m/px)</h5>
    <ul>
      <li>Longitude: {0}</li>
      <li>Latitude: {1}</li>
      <li>Zoom Level: {2}</li>
    </ul>
    <h5>Pixels</h5><ul style="list-style-type:none">{4}</ul>'''.format(*coords,
                                                                       zoom,
                                                                       scale,
                                                                       img)
    return msg


def on_click(cls, coords):
    # Change the initial widget content
    scale = scales[cls.zoom]
    content = widget_content(coords, cls.zoom, scale)
    content = '''
    <div style="width: 250px">
      <h5 style="font-weight:bold">Inspector</h5>
    {}</div>'''.format(content)
    inspector.widget.value = content

    geom = ee.Geometry.Point(coords[::-1])
    all_img = ee.Image.cat(cls.ee_layers)
    ans = all_img.reduceRegion(reducer='mean', geometry=geom, scale=scale).getInfo()

    # Iterate through all the values and append to widget html value.
    for i, (k, v) in enumerate(ans.items()):
        item = '<li>{}: {}</li>'.format(k, v)
        if i == 0:
            new_val = inspector.widget.value[:-87] + item + '</ul></div>'
        else:
            new_val = inspector.widget.value[:-11] + item + inspector.widget.value[-11:]
        inspector.widget.value = new_val
After this you just need to initialise the EEMap class and add the widget to the map:
test_map = EEMap(
    center=(48.2082, 16.3779), zoom=4,
    layout={'height':'400px'},
    events={'click': on_click}  # Note the dictionary with the event name as key
)

test_map.add_ee_layer(dem, vis={'min': 0, 'max': 2500})
test_map.add_control(inspector)
test_map
That will show the map with an 'Inspector' widget.

