Graph generator of entire npm registry. See actual visualizations here:
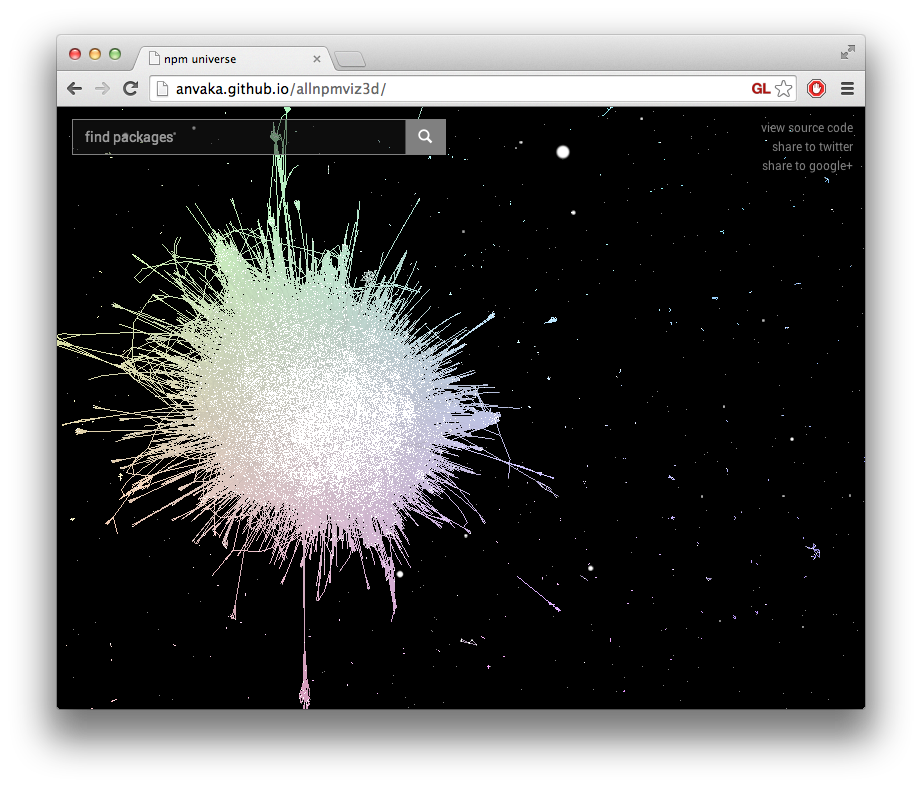
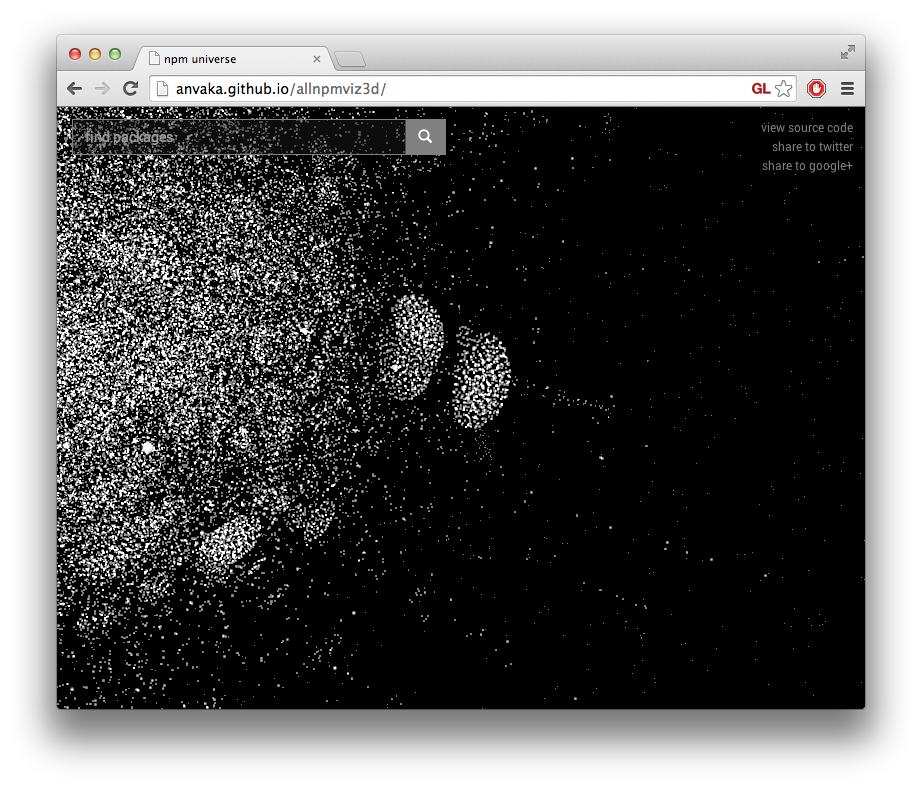
This is instructions how to generate data for 3D visualization
- Download npm metadata using
downloadGraph.shfile. If you don't have wget simply save response tobyFieldfile. I do not list url directly here, since response is huge (~124MB). - Convert response to graph:
node convertToGraph.js byField > graph.out - Run 3D layouter:
node layout3d.js graph.out. This will take you a while. Layouter saves each 5th iteration into a.pos3dfile. - Once you get to
100.pos3d(500 iterations, takes several hours) you can cancel layouter (ctrl + c). - Produce data files by running
node convertToBinary.js ./100.pos3d graph.out - Produced files should be placed into
src/dataof allnpmviz3d
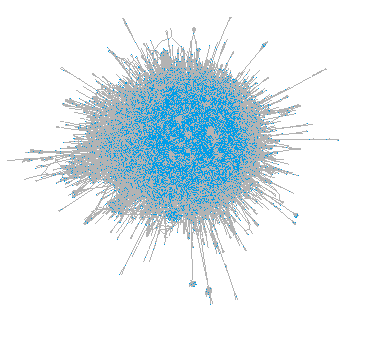
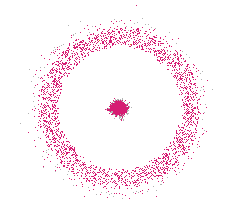
This is instructions how to generate data for 2D visualization
- Download npm metadata using
downloadGraph.shfile. If you don't have wget simply save response tobyFieldfile. I do not list url directly here, since response is huge (~124MB). - Convert response to graph:
node convertToGraph.js byField > graph.out - Run layouter:
node layout.js graph.out. This will take you a while. Layouter saves each 60th iteration into a.posfile. - Once you get 100-200 iterations saved (takes approximately 3-4 hours) you can cancel layouter (ctrl + c).
- Flatten the graph into data file:
node flatten.js byField 100.pos > graph.js
Now graph.js contains information about graph nodes/positions. Each element in the array represents a node:
{"id":"pkgName","pos":{"x":-63,"y":681},"a":"Author","d":[dependency1, dependency2, ...]}
Note: format of 2D is currently incompatible with 3D.
MIT