解决 web 应用程序中的内存泄漏问题 #6831
解决 web 应用程序中的内存泄漏问题 #6831
Conversation
|
@Glowin 校对认领 |
|
@niayyy-S 好的呢 🍺 |
|
|
||
| Part of the bargain we struck when we switched from building server-rendered websites to client-rendered SPAs is that we suddenly had to take a lot more care with the resources on the user’s device. Don’t block the UI thread, don’t make the laptop’s fan spin, don’t drain the phone’s battery, etc. We traded better interactivity and “app-like” behavior for a new class of problems that don’t really exist in the server-rendered world. | ||
| 当我们从构建服务器渲染的网站转向构建客户端渲染的单页面应用时,我们达成的协议的包括,我们突然必须更加注意用户设备上的资源。不要阻塞 UI 进程,不要让笔记本的风扇旋转,不要耗尽手机电池等等。我们使用更好的交互性和类似 app 的行为,但产生了在服务端渲染世界并没有的一些新问题。 |
There was a problem hiding this comment.
「我们达成的协议的包括」
=>
「我们达成的协议的一部分是」
|
|
||
| Part of the bargain we struck when we switched from building server-rendered websites to client-rendered SPAs is that we suddenly had to take a lot more care with the resources on the user’s device. Don’t block the UI thread, don’t make the laptop’s fan spin, don’t drain the phone’s battery, etc. We traded better interactivity and “app-like” behavior for a new class of problems that don’t really exist in the server-rendered world. | ||
| 当我们从构建服务器渲染的网站转向构建客户端渲染的单页面应用时,我们达成的协议的包括,我们突然必须更加注意用户设备上的资源。不要阻塞 UI 进程,不要让笔记本的风扇旋转,不要耗尽手机电池等等。我们使用更好的交互性和类似 app 的行为,但产生了在服务端渲染世界并没有的一些新问题。 |
There was a problem hiding this comment.
「我们使用更好的交互性和类似 app 的行为,但产生了在服务端渲染世界并没有的一些新问题」
=>
「我们用在服务端渲染中不存在的一类新问题换来了更好的交互性和更类似 app 的表现」
|
|
||
| Part of the bargain we struck when we switched from building server-rendered websites to client-rendered SPAs is that we suddenly had to take a lot more care with the resources on the user’s device. Don’t block the UI thread, don’t make the laptop’s fan spin, don’t drain the phone’s battery, etc. We traded better interactivity and “app-like” behavior for a new class of problems that don’t really exist in the server-rendered world. | ||
| 当我们从构建服务器渲染的网站转向构建客户端渲染的单页面应用时,我们达成的协议的包括,我们突然必须更加注意用户设备上的资源。不要阻塞 UI 进程,不要让笔记本的风扇旋转,不要耗尽手机电池等等。我们使用更好的交互性和类似 app 的行为,但产生了在服务端渲染世界并没有的一些新问题。 |
|
|
||
| One of these problems is memory leaks. A poorly-coded SPA can easily eat up megabytes or even gigabytes of memory, continuing to gobble up more and more resources, even as it’s sitting innocently in a background tab. At this point, the page might start to slow to a crawl, or the browser may just terminate the tab and you’ll see Chrome’s familiar “Aw, snap!” page. | ||
| 其中一个问题是内存泄漏。一个差的单页面应用会消耗兆甚至千兆的内存,持续的占用越来越多的资源,即使它仅存在于一个背景标签。 因此,页面可能开始变慢,或者浏览器会终止这个页面,你会看到 Chrome 熟悉的 ”喔唷 崩溃啦!“ 页面。 |
There was a problem hiding this comment.
「一个差的单页面应用会消耗兆甚至千兆的内存」
=>
「一个差的单页面应用可以轻松消耗 MB 甚至 GB 的内存」
|
|
||
| One of these problems is memory leaks. A poorly-coded SPA can easily eat up megabytes or even gigabytes of memory, continuing to gobble up more and more resources, even as it’s sitting innocently in a background tab. At this point, the page might start to slow to a crawl, or the browser may just terminate the tab and you’ll see Chrome’s familiar “Aw, snap!” page. | ||
| 其中一个问题是内存泄漏。一个差的单页面应用会消耗兆甚至千兆的内存,持续的占用越来越多的资源,即使它仅存在于一个背景标签。 因此,页面可能开始变慢,或者浏览器会终止这个页面,你会看到 Chrome 熟悉的 ”喔唷 崩溃啦!“ 页面。 |
There was a problem hiding this comment.
| 其中一个问题是内存泄漏。一个差的单页面应用会消耗兆甚至千兆的内存,持续的占用越来越多的资源,即使它仅存在于一个背景标签。 因此,页面可能开始变慢,或者浏览器会终止这个页面,你会看到 Chrome 熟悉的 ”喔唷 崩溃啦!“ 页面。 | |
| 其中一个问题是内存泄漏。一个差的单页面应用会消耗兆甚至千兆的内存,持续的占用越来越多的资源,即使它仅存在于一个背景标签。 因此,页面可能开始变慢,或者浏览器会终止这个页面,你会看到 Chrome 熟悉的“喔唷 崩溃啦!”页面。 |
左右引号反了
|
|
||
| When something is leaking, it’s because ([to paraphrase Joe Armstrong](https://www.johndcook.com/blog/2011/07/19/you-wanted-banana/)) you’re holding onto the banana, but you ended up getting the banana, the gorilla holding the banana, and the whole jungle. If you measure based on total bytes, you’re measuring the jungle, not the banana. | ||
| 当发生内存泄漏时,是因为([套用乔·阿姆斯特朗的话](https://www.johndcook.com/blog/2011/07/19/you-wanted-banana/)) 你抓着香蕉,但你最终得到了香蕉,大猩猩抓着香蕉,整个丛林。如果您基于总字节进行度量,那么您是在度量丛林,而不是香蕉。 |
There was a problem hiding this comment.
| 当发生内存泄漏时,是因为([套用乔·阿姆斯特朗的话](https://www.johndcook.com/blog/2011/07/19/you-wanted-banana/)) 你抓着香蕉,但你最终得到了香蕉,大猩猩抓着香蕉,整个丛林。如果您基于总字节进行度量,那么您是在度量丛林,而不是香蕉。 | |
| 当发生内存泄漏时,是因为([套用乔·阿姆斯特朗的话](https://www.johndcook.com/blog/2011/07/19/you-wanted-banana/)) 你拿着香蕉,但你最终得到了香蕉,大猩猩拿着香蕉,还有整个丛林。如果你基于总字节进行度量,那么你是在度量丛林,而不是香蕉。 |
|
|
||
| If you sort the heap snapshot diff by total memory, then it’s going to show you a bunch of arrays, strings, and objects – most of which are probably unrelated to the leak. What you really want to find is the event listener, but this takes up a minuscule amount of memory compared to the stuff it’s referencing. To fix the leak, you want to find the banana, not the jungle. | ||
| 如果您根据总内存对 heap snapshot 进行排序,那么它将向您显示一组数组、字符串和对象—其中大多数可能与内存泄漏无关。您真正想要找到的是事件监听器,但是与它所引用的东西相比,它只占用了极小的内存。要修复漏洞,你需要找到的是香蕉,而不是丛林。 |
There was a problem hiding this comment.
| 如果您根据总内存对 heap snapshot 进行排序,那么它将向您显示一组数组、字符串和对象—其中大多数可能与内存泄漏无关。您真正想要找到的是事件监听器,但是与它所引用的东西相比,它只占用了极小的内存。要修复漏洞,你需要找到的是香蕉,而不是丛林。 | |
| 如果您根据总内存对堆快照差异进行排序,那么它将向您显示一堆数组、字符串和对象 —— 其中大多数可能与内存泄漏无关。您真正想要找到的是事件监听器,但是与它所引用的东西相比,它只占用了极小的内存。要修复泄漏,你需要找到的是香蕉,而不是丛林。 |
|
|
||
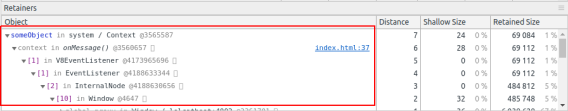
| The heap snapshot diff will also show you a “retainer” chain showing which objects are pointing to which other objects and thus keeping the memory alive. This is how you can figure out where the leaking object was allocated. | ||
| heap snapshot diff 还将向您显示一个“保持器”链,显示哪些对象指向哪些其他对象,从而保持内存活动。这就是您如何确定泄漏对象被分配到何处的方法。 |
There was a problem hiding this comment.
| heap snapshot diff 还将向您显示一个“保持器”链,显示哪些对象指向哪些其他对象,从而保持内存活动。这就是您如何确定泄漏对象被分配到何处的方法。 | |
| 堆快照差异还将向你显示一个 “retainer” 链,显示对象间的指向,从而保持内存活动。这样你就可以找出内存泄漏对象的分配位置。 |
|
|
||
| [](https://nolanwlawson.files.wordpress.com/2020/02/screenshot-from-2020-02-16-10-56-12-3.png) | ||
| [](https://nolanwlawson.files.wordpress.com/2020/02/screenshot-from-2020-02-16-10-56-12-3.png) |
There was a problem hiding this comment.
| [](https://nolanwlawson.files.wordpress.com/2020/02/screenshot-from-2020-02-16-10-56-12-3.png) | |
| [](https://nolanwlawson.files.wordpress.com/2020/02/screenshot-from-2020-02-16-10-56-12-3.png) |
|
|
||
| The retainer chain shows you which object is referencing the leaked object. The way to read it is that each object is referenced by the object below it. | ||
| 保持器链显示哪个对象正在引用泄漏的对象。读取它的方法是每个对象都由它下面的对象引用。 |
There was a problem hiding this comment.
| 保持器链显示哪个对象正在引用泄漏的对象。读取它的方法是每个对象都由它下面的对象引用。 | |
| retainer 链显示哪个对象正在引用泄漏的对象。读取它的方法是每个对象都由它下面的对象引用。 |
|
校对认领 |
|
@QinRoc 妥妥哒 🍻 |
|
|
||
| This is my basic strategy for identifying memory leaks. I’ve successfully used this technique to find dozens of memory leaks in the past. | ||
| 这是我识别内存泄漏的基本策略。我曾经成功地使用这种技术来查找过去的几十个内存泄漏。 |
There was a problem hiding this comment.
| 这是我识别内存泄漏的基本策略。我曾经成功地使用这种技术来查找过去的几十个内存泄漏。 | |
| 这是我识别内存泄漏的基本策略。我曾经成功地使用这种技术来发现了许多内存泄漏。 |
|
|
||
| I’ll precede this by saying that I haven’t found a great way to automate the detection of memory leaks. Chrome has a non-standard [performance.memory](https://webplatform.github.io/docs/apis/timing/properties/memory/) API, but for privacy reasons [it doesn’t have a very precise granularity](https://bugs.webkit.org/show_bug.cgi?id=80444), so you can’t really use it in production to identify leaks. The [W3C Web Performance Working Group](https://github.com/w3c/web-performance) has discussed [memory](https://docs.google.com/document/d/1tFCEOMOUg4zmqeHNg1Xo11Xpdm7Bmxl5y98_ESLCLgM/edit) [tooling](https://github.com/WICG/memory-pressure) in the past, but has yet to agree on a new standard to replace this API. | ||
| 在此之前,我要说的是,我还没有找到一个自动检测内存泄漏的好方法。Chrome 提供了非标准的 [performance.memory](https://webplatform.github.io/docs/apis/timing/properties/memory/) API,但是由于隐私原因[没有一个非常精确的粒度](https://bugs.webkit.org/show_bug.cgi?id=80444),所以您不能在生产中真正使用它来识别泄漏。[W3C Web 性能工作组](https://github.com/w3c/web-performance) 曾讨论了 [内存](https://docs.google.com/document/d/1tFCEOMOUg4zmqeHNg1Xo11Xpdm7Bmxl5y98_ESLCLgM/edit) [工具](https://github.com/WICG/memory-pressure) 但尚未达成新的标准来取代这个API。 |
There was a problem hiding this comment.
| 在此之前,我要说的是,我还没有找到一个自动检测内存泄漏的好方法。Chrome 提供了非标准的 [performance.memory](https://webplatform.github.io/docs/apis/timing/properties/memory/) API,但是由于隐私原因[没有一个非常精确的粒度](https://bugs.webkit.org/show_bug.cgi?id=80444),所以您不能在生产中真正使用它来识别泄漏。[W3C Web 性能工作组](https://github.com/w3c/web-performance) 曾讨论了 [内存](https://docs.google.com/document/d/1tFCEOMOUg4zmqeHNg1Xo11Xpdm7Bmxl5y98_ESLCLgM/edit) [工具](https://github.com/WICG/memory-pressure) 但尚未达成新的标准来取代这个API。 | |
| 在此之前,我要说的是,我还没有找到一个自动检测内存泄漏的好方法。Chrome 提供了非标准的 [performance.memory](https://webplatform.github.io/docs/apis/timing/properties/memory/) API,但是由于隐私原因[没有一个非常精确的粒度](https://bugs.webkit.org/show_bug.cgi?id=80444),所以您不能在生产中真正使用它来识别泄漏。[W3C Web 性能工作组](https://github.com/w3c/web-performance) 曾讨论了 [内存](https://docs.google.com/document/d/1tFCEOMOUg4zmqeHNg1Xo11Xpdm7Bmxl5y98_ESLCLgM/edit) [工具](https://github.com/WICG/memory-pressure),但尚未达成新的标准来取代这个API。 |
|
|
||
| In a lab or synthetic testing environment, you can increase the granularity on this API by using the Chrome flag [`--enable-precise-memory-info`](https://github.com/paulirish/memory-stats.js/blob/master/README.md). You can also create heap snapshot files by calling the proprietary Chromedriver command [`:takeHeapSnapshot`](https://webdriver.io/docs/api/chromium.html#takeheapsnapshot). This has the same limitation mentioned above, though – you probably want to take three in a row and discard the first two. | ||
| 在实验环境或综合测试环境中,您可以通过使用 Chrome 标志 [`--enable-precise-memory-info`](https://github.com/paulirish/memory-stats.js/blob/master/README.md)来增加这个API的粒度。您还可以通过调用专用的 Chromedriver 命令 [`:takeHeapSnapshot`](https://webdriver.io/docs/api/chromium.html#takeheapsnapshot)来创建堆快照文件。不过,这也有上面提到的限制—您可能想要连续取三个,并放弃前两个。 |
There was a problem hiding this comment.
| 在实验环境或综合测试环境中,您可以通过使用 Chrome 标志 [`--enable-precise-memory-info`](https://github.com/paulirish/memory-stats.js/blob/master/README.md)来增加这个API的粒度。您还可以通过调用专用的 Chromedriver 命令 [`:takeHeapSnapshot`](https://webdriver.io/docs/api/chromium.html#takeheapsnapshot)来创建堆快照文件。不过,这也有上面提到的限制—您可能想要连续取三个,并放弃前两个。 | |
| 在实验环境或综合测试环境中,您可以通过使用 Chrome 标志 [`--enable-precise-memory-info`](https://github.com/paulirish/memory-stats.js/blob/master/README.md)来增加这个 API 的粒度。您还可以通过调用专用的 Chromedriver 命令 [`:takeHeapSnapshot`](https://webdriver.io/docs/api/chromium.html#takeheapsnapshot) 来创建堆快照文件。不过,这也有上面提到的限制 —— 你可能想要连续取三个,并丢弃前两个。 |
|
|
||
| ****Update:** Mathias Bynens has informed me of another useful DevTools API: [`queryObjects()`](https://developers.google.com/web/updates/2017/08/devtools-release-notes#query-objects), which can show you all objects created with a particular constructor. Christoph Guttandin also has [an interesting blog post](https://media-codings.com/articles/automatically-detect-memory-leaks-with-puppeteer) about using this API for automated memory leak detection in Puppeteer.** | ||
| ****更新:** Mathias Bynens 告诉了我另一个有用的开发者工具的 API:[`queryObjects()`](https://developers.google.com/web/updates/2017/08/devtools-release-notes#query-objects),它可以显示使用特定构造函数创建的所有对象。Christoph Guttandin 也有 [一篇有趣的博客](https://media-codings.com/articles/automatically-detect-memory-leaks-with-puppeteer) 关于在 Puppeteer 中使用这个 API 进行自动内存泄漏检测。** |
|
|
||
| As with most performance problems, an ounce of prevention can be worth a pound of cure. You might find it worthwhile to put synthetic testing in place rather than trying to debug a memory leak after the fact. Especially if there are several leaks on a page, it will probably turn into an onion-peeling exercise – you fix one leak, then find another, then repeat (while weeping the whole time!). Code review can also help catch common memory leak patterns, if you know what to look for. | ||
| 与大多数性能问题一样,一分预防抵得上十分治疗。您可能会发现,在适当的地方进行综合测试比在事后调试内存泄漏更有价值。特别是当一个页面上有几个漏洞时,它可能会变成一个剥洋葱的练习——你修复一个漏洞,然后找到另一个,然后重复(在整个过程中哭泣!)如果您知道要查找什么,代码检查还可以帮助捕获常见的内存泄漏模式。 |
There was a problem hiding this comment.
| 与大多数性能问题一样,一分预防抵得上十分治疗。您可能会发现,在适当的地方进行综合测试比在事后调试内存泄漏更有价值。特别是当一个页面上有几个漏洞时,它可能会变成一个剥洋葱的练习——你修复一个漏洞,然后找到另一个,然后重复(在整个过程中哭泣!)如果您知道要查找什么,代码检查还可以帮助捕获常见的内存泄漏模式。 | |
| 与大多数性能问题一样,一分预防抵得上十分治疗。您可能会发现,在适当的地方进行综合测试比在事后调试内存泄漏更有价值。特别是当一个页面上有几个漏洞时,它可能会变成一个剥洋葱的练习 —— 你修复一个漏洞,然后找到另一个,然后重复(在整个过程中哭泣!)如果您知道要查找什么,代码检查也可以帮助捕获常见的内存泄漏模式。 |
|
|
||
| Since event listeners are the most common source of memory leaks, another technique that I’ve used is to monkey-patch the `addEventListener` and `removeEventListener` APIs to count the references and ensure they return to zero. Here is [an example](https://github.com/nolanlawson/pinafore/blob/2edbd4746dfb5a7c894cb8861cf315c800a16393/tests/spyDomListeners.js) of how to do that. | ||
| 由于事件监听器是最常见的内存泄漏源,所以我使用的另一种技术是对 `addEventListener` 和 `removeEventListener` 的 API 进行重写以记录原型并确保它们返回零。这个[例子](https://github.com/nolanlawson/pinafore/blob/2edbd4746dfb5a7c894cb8861cf315c800a16393/tests/spyDomListeners.js)讲述了如何操作。 |
There was a problem hiding this comment.
| 由于事件监听器是最常见的内存泄漏源,所以我使用的另一种技术是对 `addEventListener` 和 `removeEventListener` 的 API 进行重写以记录原型并确保它们返回零。这个[例子](https://github.com/nolanlawson/pinafore/blob/2edbd4746dfb5a7c894cb8861cf315c800a16393/tests/spyDomListeners.js)讲述了如何操作。 | |
| 由于事件监听器是最常见的内存泄漏源,所以我使用的另一种技术是对 `addEventListener` 和 `removeEventListener` 的 API 进行功能追加以记录原型并确保它们返回零。这个[例子](https://github.com/nolanlawson/pinafore/blob/2edbd4746dfb5a7c894cb8861cf315c800a16393/tests/spyDomListeners.js)讲述了如何操作。 |
monkey - patch 作用
- 在运行时替换方法、属性等
- 在不修改第三方代码的情况下增加原来不支持的功能
- 在运行时为内存中的对象增加patch而不是在磁盘的源代码中增加
我觉得在本段中是对 API 功能进行增加,用来记录原型
|
|
||
| JavaScript is a memory-safe language, so it’s somewhat ironic how easy it is to leak memory in a web application. Part of this is just inherent to UI design, though – we need to listen for mouse events, scroll events, keyboard events, etc., and these are all patterns that can easily lead to memory leaks. But by trying to keep our web applications’ memory usage low, we can improve runtime performance, avoid crashes, and be respectful of resource constraints on the user’s device. | ||
| JavaScript 是一种内存安全语言,因此在 web 应用程序中泄漏内存是多么容易,这有点讽刺意味。这部分是 UI 设计固有的——我们需要监听鼠标事件、滚动事件、键盘事件等等,而这些都是很容易导致内存泄漏的模式。但是,通过尽量降低 web 应用程序的内存使用量,我们可以提高运行时性能,避免崩溃,并尊重用户设备上的资源限制。 |
There was a problem hiding this comment.
| JavaScript 是一种内存安全语言,因此在 web 应用程序中泄漏内存是多么容易,这有点讽刺意味。这部分是 UI 设计固有的——我们需要监听鼠标事件、滚动事件、键盘事件等等,而这些都是很容易导致内存泄漏的模式。但是,通过尽量降低 web 应用程序的内存使用量,我们可以提高运行时性能,避免崩溃,并尊重用户设备上的资源限制。 | |
| JavaScript 是一种内存安全语言,因此在 web 应用程序中泄漏内存是多么容易,这有点讽刺意味。其中一部分是 UI 设计固有的 —— 我们需要监听鼠标事件、滚动事件、键盘事件等等,而这些都是很容易导致内存泄漏的模式。但是,通过尽量降低 web 应用程序的内存使用量,我们可以提高运行时性能,避免崩溃,并尊重用户设备上的资源限制。 |
|
@niayyy-S 感谢校对~,已修改 |
|
校对认领 |
|
校对认领 @fanyijihua |
| @@ -1,124 +1,124 @@ | |||
| > * 原文地址:[Fixing memory leaks in web applications](https://nolanlawson.com/2020/02/19/fixing-memory-leaks-in-web-applications/) | |||
| > * 原文地址:[Fixing memory leaks in web applications](https://nolanlawson.com/2020/02/19/fixing-memory-leaks-in-web-applications/) | |||
| > * 原文作者:[Nolan](https://nolanlawson.com/) | |||
| > * 译文出自:[掘金翻译计划](https://github.com/xitu/gold-miner) | |||
| > * 本文永久链接:[https://github.com/xitu/gold-miner/blob/master/TODO1/fixing-memory-leaks-in-web-applications.md](https://github.com/xitu/gold-miner/blob/master/TODO1/fixing-memory-leaks-in-web-applications.md) | |||
| > * 译者: | |||
| > * 校对者: | |||
|
|
||
| Part of the bargain we struck when we switched from building server-rendered websites to client-rendered SPAs is that we suddenly had to take a lot more care with the resources on the user’s device. Don’t block the UI thread, don’t make the laptop’s fan spin, don’t drain the phone’s battery, etc. We traded better interactivity and “app-like” behavior for a new class of problems that don’t really exist in the server-rendered world. | ||
| 当我们从构建服务器渲染的网站转向构建客户端渲染的单页面应用时,我们达成的协议的一部分是,我们突然必须更加注意用户设备上的资源。不要阻塞 UI 进程,不要让笔记本的风扇旋转,不要损耗手机电池等等。我们用在服务端渲染中不存在的一类新问题换来了更好的交互性和更类似 app 的表现。 |
There was a problem hiding this comment.
【当我们从构建服务器渲染的网站转向构建客户端渲染的单页面应用时,我们达成的协议的一部分是,我们突然必须更加注意用户设备上的资源。】->【当我们由服务端渲染的应用切换到客户端渲染的单页面应用时,我们要付出的一部分代价就是,必须更加注重用户设备上的资源。】
【不要阻塞 UI 进程,不要让笔记本的风扇旋转,不要损耗手机电池等等。】->【不要阻塞 UI 线程,不要让笔记本的风扇呼呼旋转,不要耗尽手机电池等等。】
There was a problem hiding this comment.
【不要损耗手机电池】这里按照@niayyy-S的意见改成损耗,我觉得损耗更合适一些
|
|
||
| One of these problems is memory leaks. A poorly-coded SPA can easily eat up megabytes or even gigabytes of memory, continuing to gobble up more and more resources, even as it’s sitting innocently in a background tab. At this point, the page might start to slow to a crawl, or the browser may just terminate the tab and you’ll see Chrome’s familiar “Aw, snap!” page. | ||
| 其中一个问题是内存泄漏。一个差的单页面应用会消耗 MB 甚至 GB 的内存,持续的占用越来越多的资源,即使它仅存在于一个背景标签。 因此,页面可能开始变慢,或者浏览器会终止这个页面,你会看到 Chrome 熟悉的“喔唷 崩溃啦” 页面。 |
There was a problem hiding this comment.
【其中一个问题是内存泄漏。】->【这类新问题中,其中一个问题就是内存泄漏】
【一个差的单页面应用很容易就会耗费 MB 甚至 GB 的内存,即使它在浏览器中被你切换到后台变成不可见,它还会随着应用的运行占用越来越多的内存资源。】
【 因此,页面可能开始变慢,或者浏览器会终止这个页面,你会看到 Chrome 熟悉的“喔唷 崩溃啦” 页面。】->【因此,页面就会开始变慢,或者浏览器就会终止这个页面,然后你会看到 Chrome 下熟悉的“喔唷 崩溃啦” 页面。】
|
|
||
| The subject of memory leaks is not well-covered in the web development literature. And yet, I’m pretty sure that most non-trivial SPAs leak memory, unless the team behind them has a robust infrastructure for catching and fixing memory leaks. It’s just far too easy in JavaScript to accidentally allocate some memory and forget to clean it up. | ||
| 关于内存泄漏的内容在 web 开发的文章中没有得到很好的覆盖。但是,我确定大多数重要的单页面应用都存在内存泄漏问题,除非他们背后的团队有一个强大的基础架构来捕获和修复内存泄漏。在 JavaScript 中,很容易意外地分配一些内存而忘记清理。 |
There was a problem hiding this comment.
【关于内存泄漏的内容在 web 开发的文章中没有得到很好的覆盖。】->【在 web 开发的文章中与内存相关的内容并没有很多。】
【在 JavaScript 中,很容易意外地分配一些内存而忘记清理。】->【在 JavaScript 中,意外地分配一些内存而忘记清理是很容易发生的。】
| * **Lack of data**: the Chrome team doesn’t provide data about how much memory websites are using in the wild. Nor are websites often measuring this themselves. | ||
| * **Lack of tooling**: it’s still not easy to identify or fix memory leaks with existing tooling. | ||
| * **Lack of caring**: browsers are pretty good at killing tabs that consume too much memory. Plus people seem to [blame the browser](https://www.google.com/search?hl=en&q=chrome%20memory%20hog) rather than the websites. | ||
| * **缺乏反馈**:大多数使用者在他们上网时不会认真观察他们的任务管理器。通常,除非泄漏严重到页面崩溃或应用程序运行缓慢,否则您不会得到用户的反馈。 |
There was a problem hiding this comment.
【否则您不会得到用户的反馈。】->【否则你不会得到用户的反馈。】
|
|
||
| (Another helpful technique is to run through the scenario once before recording the first snapshot. Especially if you are using a lot of code-splitting, then your scenario is likely to have a one-time memory cost of loading the necessary JavaScript modules.) | ||
| (另一种有用的技术是在记录第一个快照之前遍历场景一次。特别是如果您使用了大量的代码分解,那么你的场景很可能需要一次性的内存开销来加载必要的 JavaScript 模块。) |
There was a problem hiding this comment.
【另一种有用的技术】->【另一种很有用的技巧】
【代码分解,那么你的场景很可能需要一次性的内存开销来加载必要的 JavaScript 模块】->【代码拆分,来实现按需加载,那么你的场景很可能需要一次性的内存开销来加载必要的 JavaScript 模块】
|
|
||
| JavaScript is a memory-safe language, so it’s somewhat ironic how easy it is to leak memory in a web application. Part of this is just inherent to UI design, though – we need to listen for mouse events, scroll events, keyboard events, etc., and these are all patterns that can easily lead to memory leaks. But by trying to keep our web applications’ memory usage low, we can improve runtime performance, avoid crashes, and be respectful of resource constraints on the user’s device. | ||
| JavaScript 是一种内存安全语言,因此在 web 应用程序中泄漏内存是多么容易,这有点讽刺意味。其中一部分是 UI 设计固有的 —— 我们需要监听鼠标事件、滚动事件、键盘事件等等,而这些都是很容易导致内存泄漏的模式。但是,通过尽量降低 web 应用程序的内存使用量,我们可以提高运行时性能,避免崩溃,并尊重用户设备上的资源限制。 |
There was a problem hiding this comment.
【JavaScript 是一种内存安全语言,因此在 web 应用程序中泄漏内存是多么容易,这有点讽刺意味。】-》【JavaScript 是一种内存安全的语言,但它在 web 应用程序中泄漏内存是多么容易,所以这句话多少有些讽刺意味。】
|
|
||
| As with most performance problems, an ounce of prevention can be worth a pound of cure. You might find it worthwhile to put synthetic testing in place rather than trying to debug a memory leak after the fact. Especially if there are several leaks on a page, it will probably turn into an onion-peeling exercise – you fix one leak, then find another, then repeat (while weeping the whole time!). Code review can also help catch common memory leak patterns, if you know what to look for. | ||
| 与大多数性能问题一样,一分预防抵得上十分治疗。您可能会发现,在适当的地方进行综合测试比在事后调试内存泄漏更有价值。特别是当一个页面上有几个漏洞时,它可能会变成一个剥洋葱的练习 —— 你修复一个漏洞,然后找到另一个,然后重复(在整个过程中哭泣!)如果您知道要查找什么,代码检查也可以帮助捕获常见的内存泄漏模式。 |
There was a problem hiding this comment.
【一分预防抵得上十分治疗】->【预防内存泄漏比发现后再修复重要的多】
|
|
||
| When something is leaking, it’s because ([to paraphrase Joe Armstrong](https://www.johndcook.com/blog/2011/07/19/you-wanted-banana/)) you’re holding onto the banana, but you ended up getting the banana, the gorilla holding the banana, and the whole jungle. If you measure based on total bytes, you’re measuring the jungle, not the banana. | ||
| 当发生内存泄漏时,是因为([套用乔·阿姆斯特朗的话](https://www.johndcook.com/blog/2011/07/19/you-wanted-banana/)) 你拿着香蕉,但你最终得到了香蕉,大猩猩拿着香蕉,还有整个丛林。如果你基于总字节进行度量,那么你是在度量丛林,而不是香蕉。 |
There was a problem hiding this comment.
【你拿着香蕉,但你最终得到了香蕉,大猩猩拿着香蕉,还有整个丛林。】->【你想要一个香蕉,但你最终得到的是一只大猩猩拿着香蕉和整个丛林。如果你基于总字节进行度量,那么你是在度量丛林,而不是香蕉。】
|
校对完成 @fanyijihua |
|
@febrainqu 校对完成 |
| * **Lack of data**: the Chrome team doesn’t provide data about how much memory websites are using in the wild. Nor are websites often measuring this themselves. | ||
| * **Lack of tooling**: it’s still not easy to identify or fix memory leaks with existing tooling. | ||
| * **Lack of caring**: browsers are pretty good at killing tabs that consume too much memory. Plus people seem to [blame the browser](https://www.google.com/search?hl=en&q=chrome%20memory%20hog) rather than the websites. | ||
| * **缺乏反馈**:大多数使用者在他们上网时不会认真观察他们的任务管理器。通常,除非泄漏严重到页面崩溃或应用程序运行缓慢,否则您不会得到用户的反馈。 |
There was a problem hiding this comment.
「否则您不会得到用户的反馈。」=> 「否则你不会得到用户的反馈。」
| * **缺乏反馈**:大多数使用者在他们上网时不会认真观察他们的任务管理器。通常,除非泄漏严重到页面崩溃或应用程序运行缓慢,否则您不会得到用户的反馈。 | ||
| * **缺乏数据**:Chrome 团队不会提供关于网站通常使用了多少内存的数据。网站通常也不自己测量。 | ||
| * **缺乏工具**:使用现有工具识别或修复内存泄漏仍然困难。 | ||
| * **缺乏关心**:浏览器非常擅长杀死消耗过多内存的页面。大多数人似乎认为这是[浏览器的责任](https://www.google.com/search?hl=en&q=chrome%20memory%20hog) 而不是网页的责任。 |
There was a problem hiding this comment.
「大多数人似乎认为这是浏览器的责任 而不是网页的责任。」 => 「而且人们会把这种问题归咎于浏览器而不是网站。」
|
|
||
| window.addEventListener('message', this.onMessage.bind(this)); | ||
|
|
||
| That’s it. That’s all it takes to introduce a memory leak. If you call [`addEventListener`](https://developer.mozilla.org/en-US/docs/Web/API/EventTarget/addEventListener) on some global object (the `window`, the `<body>`, etc.) and then forget to clean it up with [`removeEventListener`](https://developer.mozilla.org/en-US/docs/Web/API/EventTarget/removeEventListener) when the component is unmounted, then you’ve created a memory leak. | ||
| 就是这样。就这样引入内存泄漏的。如果你调用 [`addEventListener`](https://developer.mozilla.org/en-US/docs/Web/API/EventTarget/addEventListener) 在一些全局对象中(例如 `window`, `<body>` 等。)然后忘记用 [`removeEventListener`](https://developer.mozilla.org/en-US/docs/Web/API/EventTarget/removeEventListener) 将他们清理干净。当组件被卸载,你就已经创建了一个内存泄漏。 |
There was a problem hiding this comment.
「就这样引入内存泄漏的。」 => 「这样就会导致内存泄漏。」
|
|
||
| Worse, you’ve just leaked your entire component. Because `this.onMessage` is bound to `this`, the component has leaked. So have all of its child components. And very likely, so have all the DOM nodes associated with the components. This can get very bad very fast. | ||
| 更糟糕的是,您刚刚泄漏了整个组件。因为 `this.onMessage` 绑定到 `this`,因此组件已泄漏。因此他的所有子组件也泄漏。 而且很可能所有与组件相关联的 DOM 节点也是如此。这会很快变得非常糟糕。 |
There was a problem hiding this comment.
「您刚刚泄漏了整个组件。」 => 「你刚刚泄漏了整个组件。」
|
|
||
| Worse, you’ve just leaked your entire component. Because `this.onMessage` is bound to `this`, the component has leaked. So have all of its child components. And very likely, so have all the DOM nodes associated with the components. This can get very bad very fast. | ||
| 更糟糕的是,您刚刚泄漏了整个组件。因为 `this.onMessage` 绑定到 `this`,因此组件已泄漏。因此他的所有子组件也泄漏。 而且很可能所有与组件相关联的 DOM 节点也是如此。这会很快变得非常糟糕。 |
There was a problem hiding this comment.
「因此他的所有子组件也泄漏。」 => 「因此它的所有子组件也都会泄漏。」
|
|
||
| In the Chrome DevTools, you can also use the proprietary [`getEventListeners()`](https://developers.google.com/web/tools/chrome-devtools/console/utilities#geteventlisteners) API to see the event listeners attached to a particular element. Note that this can only be used in DevTools, though. | ||
| 在 Chrome 开发者工具中,您还可以使用专用的 [`getEventListeners()`](https://developers.google.com/web/tools/chrome-devtools/console/utilities#geteventlisteners) API 来查看附加到特定元素的事件监听器。注意,这只能在开发者工具中使用。 |
|
|
||
| ****Update:** Mathias Bynens has informed me of another useful DevTools API: [`queryObjects()`](https://developers.google.com/web/updates/2017/08/devtools-release-notes#query-objects), which can show you all objects created with a particular constructor. Christoph Guttandin also has [an interesting blog post](https://media-codings.com/articles/automatically-detect-memory-leaks-with-puppeteer) about using this API for automated memory leak detection in Puppeteer.** | ||
| ****更新:** Mathias Bynens告诉了我另一个有用的开发者工具的 API:[`queryObjects()`](https://developers.google.com/web/updates/2017/08/devtools-release-notes#query-objects),它可以显示使用特定构造函数创建的所有对象。Christoph Guttandin 也有 [一篇有趣的博客](https://media-codings.com/articles/automatically-detect-memory-leaks-with-puppeteer) 关于在 Puppeteer 中使用这个API进行自动内存泄漏检测。** |
There was a problem hiding this comment.
「Mathias Bynens告诉了我」 => 「Mathias Bynens 告诉了我」
There was a problem hiding this comment.
「使用这个API进行自动内存泄漏检测」 => 「使用这个 API 来自动检测内存泄漏」
|
|
||
| The state of finding and fixing memory leaks in web apps is still fairly rudimentary. In this blog post, I’ve covered some of the techniques that have worked for me, but admittedly this is still a difficult and time-consuming process. | ||
| 在 web 应用程序中查找和修复内存泄漏的状态仍然相当初级。在这篇博客文章中,我介绍了一些对我有用的技术,但必须承认,这仍然是一个困难和耗时的过程。 |
There was a problem hiding this comment.
「在 web 应用程序中查找和修复内存泄漏的状态仍然相当初级。」 => 「在 web 应用程序中查找和修复内存泄漏仍然处于初级阶段。」
|
|
||
| As with most performance problems, an ounce of prevention can be worth a pound of cure. You might find it worthwhile to put synthetic testing in place rather than trying to debug a memory leak after the fact. Especially if there are several leaks on a page, it will probably turn into an onion-peeling exercise – you fix one leak, then find another, then repeat (while weeping the whole time!). Code review can also help catch common memory leak patterns, if you know what to look for. | ||
| 与大多数性能问题一样,一分预防抵得上十分治疗。您可能会发现,在适当的地方进行综合测试比在事后调试内存泄漏更有价值。特别是当一个页面上有几个漏洞时,它可能会变成一个剥洋葱的练习——你修复一个漏洞,然后找到另一个,然后重复(在整个过程中哭泣!)如果您知道要查找什么,代码检查还可以帮助捕获常见的内存泄漏模式。 |
|
|
||
| JavaScript is a memory-safe language, so it’s somewhat ironic how easy it is to leak memory in a web application. Part of this is just inherent to UI design, though – we need to listen for mouse events, scroll events, keyboard events, etc., and these are all patterns that can easily lead to memory leaks. But by trying to keep our web applications’ memory usage low, we can improve runtime performance, avoid crashes, and be respectful of resource constraints on the user’s device. | ||
| JavaScript 是一种内存安全语言,因此在 web 应用程序中泄漏内存是多么容易,这有点讽刺意味。这部分是 UI 设计固有的——我们需要监听鼠标事件、滚动事件、键盘事件等等,而这些都是很容易导致内存泄漏的模式。但是,通过尽量降低 web 应用程序的内存使用量,我们可以提高运行时性能,避免崩溃,并尊重用户设备上的资源限制。 |
There was a problem hiding this comment.
「JavaScript 是一种内存安全语言,因此在 web 应用程序中泄漏内存是多么容易,这有点讽刺意味。」 => 「JavaScript 是一门内存安全的语言,在 web 应用程序中这么容易泄漏内存,实在是有点讽刺。」
|
已根据校对建议进行修改,麻烦各位看一下还有什么问题 @niayyy-S @QinRoc @cyz980908 |
|
|
||
| Part of the bargain we struck when we switched from building server-rendered websites to client-rendered SPAs is that we suddenly had to take a lot more care with the resources on the user’s device. Don’t block the UI thread, don’t make the laptop’s fan spin, don’t drain the phone’s battery, etc. We traded better interactivity and “app-like” behavior for a new class of problems that don’t really exist in the server-rendered world. | ||
| 当我们由服务端渲染的应用切换到客户端渲染的单页面应用时,我们要付出的一部分代价就是,必须更加注重用户设备上的资源。不要阻塞 UI 进程,不要让笔记本的风扇旋转,不要损耗手机电池等等。我们用在服务端渲染中不存在的一类新问题换来了更好的交互性和更类似 app 的表现。 |
There was a problem hiding this comment.
「我们要付出的一部分代价就是」 => 「我们要付出的一部分代价是」
|
|
||
| One of these problems is memory leaks. A poorly-coded SPA can easily eat up megabytes or even gigabytes of memory, continuing to gobble up more and more resources, even as it’s sitting innocently in a background tab. At this point, the page might start to slow to a crawl, or the browser may just terminate the tab and you’ll see Chrome’s familiar “Aw, snap!” page. | ||
| 这类新问题中,其中一个问题就是内存泄漏。一个差的单页面应用会消耗 MB 甚至 GB 的内存,持续的占用越来越多的资源,即使它仅存在于一个背景标签。 因此,页面可能开始变慢,或者浏览器终止这个页面,你会看到 Chrome 熟悉的“喔唷 崩溃啦” 页面。 |
There was a problem hiding this comment.
「持续的占用越来越多的资源」 => 「持续地占用越来越多的资源」
|
|
||
| window.addEventListener('message', this.onMessage.bind(this)); | ||
|
|
||
| That’s it. That’s all it takes to introduce a memory leak. If you call [`addEventListener`](https://developer.mozilla.org/en-US/docs/Web/API/EventTarget/addEventListener) on some global object (the `window`, the `<body>`, etc.) and then forget to clean it up with [`removeEventListener`](https://developer.mozilla.org/en-US/docs/Web/API/EventTarget/removeEventListener) when the component is unmounted, then you’ve created a memory leak. | ||
| 就是这样。就这样导致内存泄漏的。如果你调用 [`addEventListener`](https://developer.mozilla.org/en-US/docs/Web/API/EventTarget/addEventListener) 在一些全局对象中(例如 `window`, `<body>` 等。)然后忘记用 [`removeEventListener`](https://developer.mozilla.org/en-US/docs/Web/API/EventTarget/removeEventListener) 将他们清理干净。当组件被卸载,你就已经创建了一个内存泄漏。 |
There was a problem hiding this comment.
「就这样导致内存泄漏的。」 => 「这样就会导致内存泄漏。」
|
|
||
| window.addEventListener('message', this.onMessage.bind(this)); | ||
|
|
||
| That’s it. That’s all it takes to introduce a memory leak. If you call [`addEventListener`](https://developer.mozilla.org/en-US/docs/Web/API/EventTarget/addEventListener) on some global object (the `window`, the `<body>`, etc.) and then forget to clean it up with [`removeEventListener`](https://developer.mozilla.org/en-US/docs/Web/API/EventTarget/removeEventListener) when the component is unmounted, then you’ve created a memory leak. | ||
| 就是这样。就这样导致内存泄漏的。如果你调用 [`addEventListener`](https://developer.mozilla.org/en-US/docs/Web/API/EventTarget/addEventListener) 在一些全局对象中(例如 `window`, `<body>` 等。)然后忘记用 [`removeEventListener`](https://developer.mozilla.org/en-US/docs/Web/API/EventTarget/removeEventListener) 将他们清理干净。当组件被卸载,你就已经创建了一个内存泄漏。 |
There was a problem hiding this comment.
「如果你调用 addEventListener 在一些全局对象中(例如 window, <body> 等。)然后忘记用 removeEventListener 将他们清理干净。」 => 「如果你在一些全局对象(例如 window, <body> 等)中调用 addEventListener ,然后忘记用 removeEventListener 将它们清理干净。」
|
|
||
| window.addEventListener('message', this.onMessage.bind(this)); | ||
|
|
||
| That’s it. That’s all it takes to introduce a memory leak. If you call [`addEventListener`](https://developer.mozilla.org/en-US/docs/Web/API/EventTarget/addEventListener) on some global object (the `window`, the `<body>`, etc.) and then forget to clean it up with [`removeEventListener`](https://developer.mozilla.org/en-US/docs/Web/API/EventTarget/removeEventListener) when the component is unmounted, then you’ve created a memory leak. | ||
| 就是这样。就这样导致内存泄漏的。如果你调用 [`addEventListener`](https://developer.mozilla.org/en-US/docs/Web/API/EventTarget/addEventListener) 在一些全局对象中(例如 `window`, `<body>` 等。)然后忘记用 [`removeEventListener`](https://developer.mozilla.org/en-US/docs/Web/API/EventTarget/removeEventListener) 将他们清理干净。当组件被卸载,你就已经创建了一个内存泄漏。 |
There was a problem hiding this comment.
「当组件被卸载,你就已经创建了一个内存泄漏。」 => 「当组件被卸载时,你就创建了一个内存泄漏。」
|
|
||
| In the above example, there is a variable called `someObject` which is referenced by a closure (aka “context”), which is referenced by an event listener. If you click the source link, it will take you to the JavaScript declaration, which is fairly straightforward: | ||
| 在上面的例子中,有一个名为 `someObject` 的变量,它被一个闭包(又名“上下文”)引用,这个闭包由被一个事件监听器引用。 如果你点击源链接,它会跳转到 JavaScript 声明,这种方式相当直接明了: |
There was a problem hiding this comment.
「这个闭包由被一个事件监听器引用」 => 「这个闭包又被一个事件监听器引用」
| 1. If you save and re-load the snapshot file, then you will lose all the file references to where the object was allocated. So for instance, you won’t see that the event listener’s closure comes from line 22 of `foo.js`. Since this is really critical information, it’s almost useless to save and send heap snapshot files. | ||
| 2. If there are [`WeakMap`s](https://developer.mozilla.org/en-US/docs/Web/JavaScript/Reference/Global_Objects/WeakMap) involved, then Chrome will show you those references even though they don’t really matter – those objects would be de-allocated as soon as the other references are cleaned up. So they are just noise. | ||
| 3. Chrome classifies the objects by their prototype. So the more you use actual classes/functions and the less you use anonymous objects, the easier it will be to see what exactly is leaking. As an example, imagine if our leak was somehow due to an `object` rather than an `EventListener`. Since `object` is extremely generic, we’re unlikely to see exactly 7 of them leaking. | ||
| 1. 如果保存并重新加载快照文件,则将丢失对分配对象的位置的所有文件引用。例如,你不会看到 `foo.js` 第22行的事件监听器闭包。由于这是非常重要的信息,所以保存和发送堆快照文件几乎毫无用处。 |
There was a problem hiding this comment.
「第22行的事件监听器闭包」 => 「第 22 行的事件监听器闭包」
|
|
||
| This is my basic strategy for identifying memory leaks. I’ve successfully used this technique to find dozens of memory leaks in the past. | ||
| 这是我识别内存泄漏的基本策略。我曾经成功地使用这种技术来发现了许多内存泄漏。 |
There was a problem hiding this comment.
「我曾经成功地使用这种技术来发现了许多内存泄漏。」 => 「我曾经成功地使用这种技术发现了许多内存泄漏。」
|
|
||
| In the Chrome DevTools, you can also use the proprietary [`getEventListeners()`](https://developers.google.com/web/tools/chrome-devtools/console/utilities#geteventlisteners) API to see the event listeners attached to a particular element. Note that this can only be used in DevTools, though. | ||
| 在 Chrome 开发者工具中,你还可以使用专用的 [`getEventListeners()`](https://developers.google.com/web/tools/chrome-devtools/console/utilities#geteventlisteners) API 来查看附加到特定元素的事件监听器。注意,这只能在开发者工具中使用。 |
There was a problem hiding this comment.
「来查看附加到特定元素的事件监听器」 => 「来查看绑定到特定元素上的事件监听器」
|
|
||
| ****Update:** Mathias Bynens has informed me of another useful DevTools API: [`queryObjects()`](https://developers.google.com/web/updates/2017/08/devtools-release-notes#query-objects), which can show you all objects created with a particular constructor. Christoph Guttandin also has [an interesting blog post](https://media-codings.com/articles/automatically-detect-memory-leaks-with-puppeteer) about using this API for automated memory leak detection in Puppeteer.** | ||
| ****更新:** Mathias Bynens 告诉了我另一个有用的开发者工具的 API:[`queryObjects()`](https://developers.google.com/web/updates/2017/08/devtools-release-notes#query-objects),它可以显示使用特定构造函数创建的所有对象。Christoph Guttandin 也有 [一篇有趣的博客文章](https://media-codings.com/articles/automatically-detect-memory-leaks-with-puppeteer) 关于在 Puppeteer 中使用这个 API 进行自动内存泄漏检测。** |
|
@febrainqu 我直接在 repo 里改了一些标点符号和格式,得麻烦您发布前同步一下本地文件 |
|
@niayyy-S @QinRoc @cyz980908 感谢三位细致的校对!本文登记时校对额外加 1 分 |
|
@febrainqu 已经 merge 啦~ 快快麻溜发布到掘金然后给我发下链接,方便及时添加积分哟。 掘金翻译计划有自己的知乎专栏,你也可以投稿哈,推荐使用一个好用的插件。 |
译文翻译完成,resolve #6736