You signed in with another tab or window. Reload to refresh your session.You signed out in another tab or window. Reload to refresh your session.You switched accounts on another tab or window. Reload to refresh your session.Dismiss alert
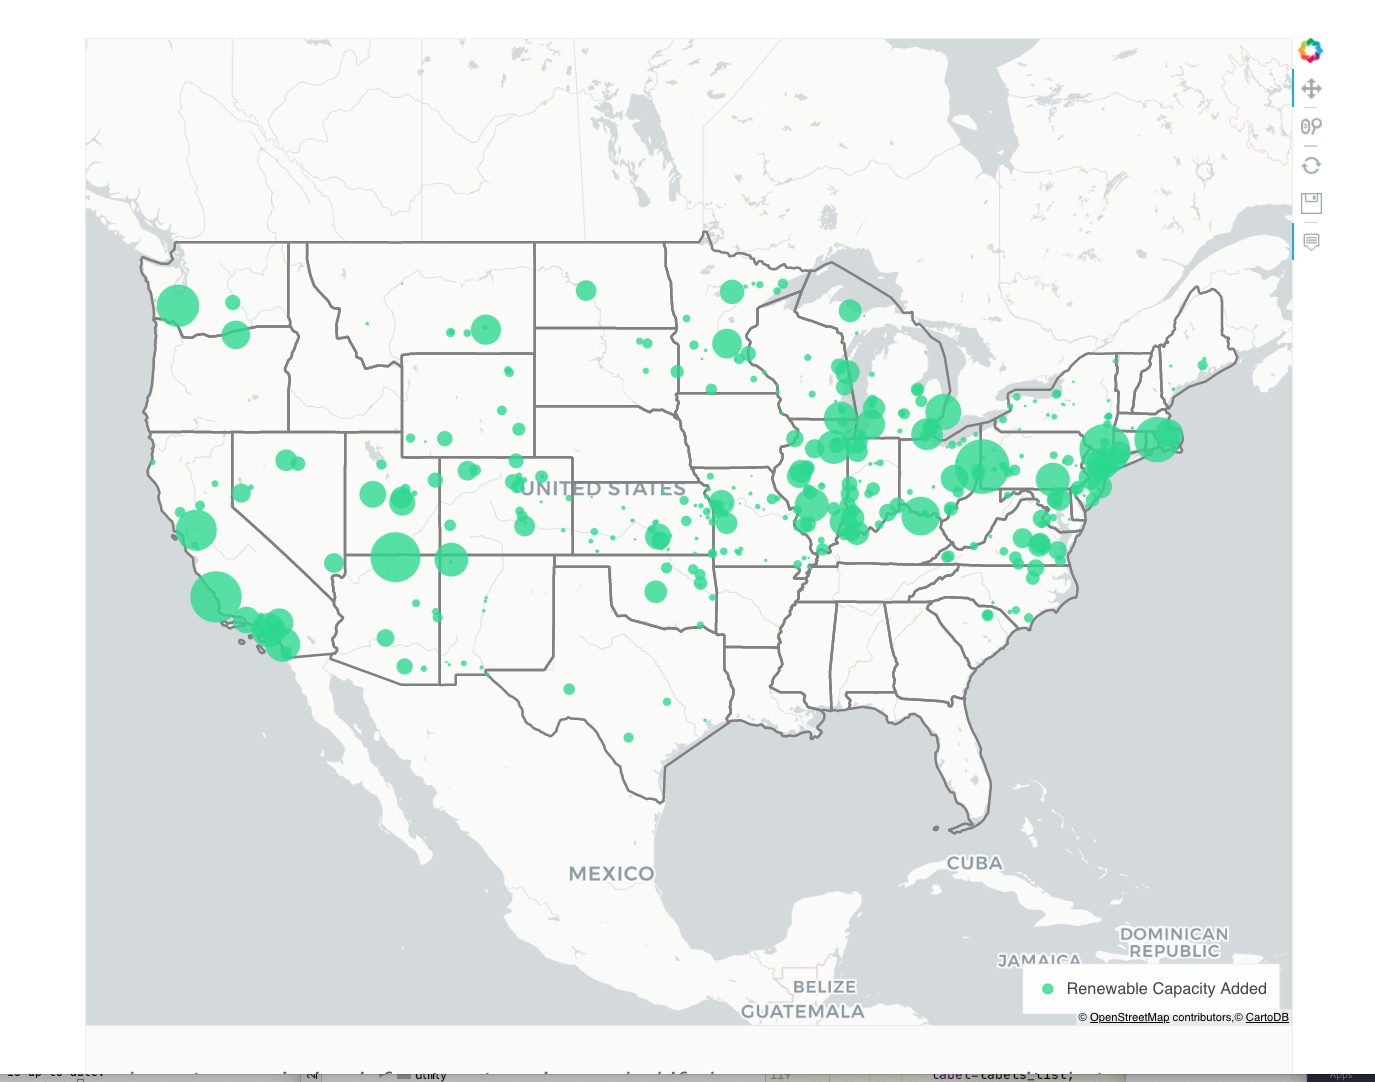
Renewable capacity added (aka renewables at retirements) map is featured on scrolly-telling. Code needs to be integrated into the code base for reproducibility and use of the code for other scenarios. This map uses the change table and is currently the only bokeh map that uses this as a data source for plotting:
The text was updated successfully, but these errors were encountered:
Renewable capacity added (aka renewables at retirements) map is featured on scrolly-telling. Code needs to be integrated into the code base for reproducibility and use of the code for other scenarios. This map uses the change table and is currently the only bokeh map that uses this as a data source for plotting:

The text was updated successfully, but these errors were encountered: