-
Notifications
You must be signed in to change notification settings - Fork 51
Irrigation
Four irrigation scenarios available (to be set in lpjml.conf):
-
NO_IRRIGATION– irrigation switched off, land frac of irrigated cfts are added to rain-fed cft fraction -
LIM_IRRIGATION– limited irrigation, constrained by surface water availability (requires RIVER_ROUTING) -
POT_IRRIGATION– potential irrigation, unlimited water resources available for irrigation -
ALL_IRRIGATION– all cropland is being irrigated, land frac of rain-fed cfts are added to irrigated cft fraction
The POT_IRRIGATION scenario has available unlimited blue water
resources for irrigation. Supply restrictions are bypassed and it is
assumed that the additional demand is met by fossil groundwater
resources and remote water resources to a large but unknown degree.
Note, however, that this approach neglects supra-regional blue water
limitations and farmers’ choices to avoid irrigation even if crops are
water limited.
If using landuse scenario ALL_CROPS, use POT_IRRIGATION, because
LIM_IRRIGATION does not make sense with a synthetic cft cell fraction
(all cfts are assigned 1% of cell area).
More irrigation parameters are set in par/param.par, see below.

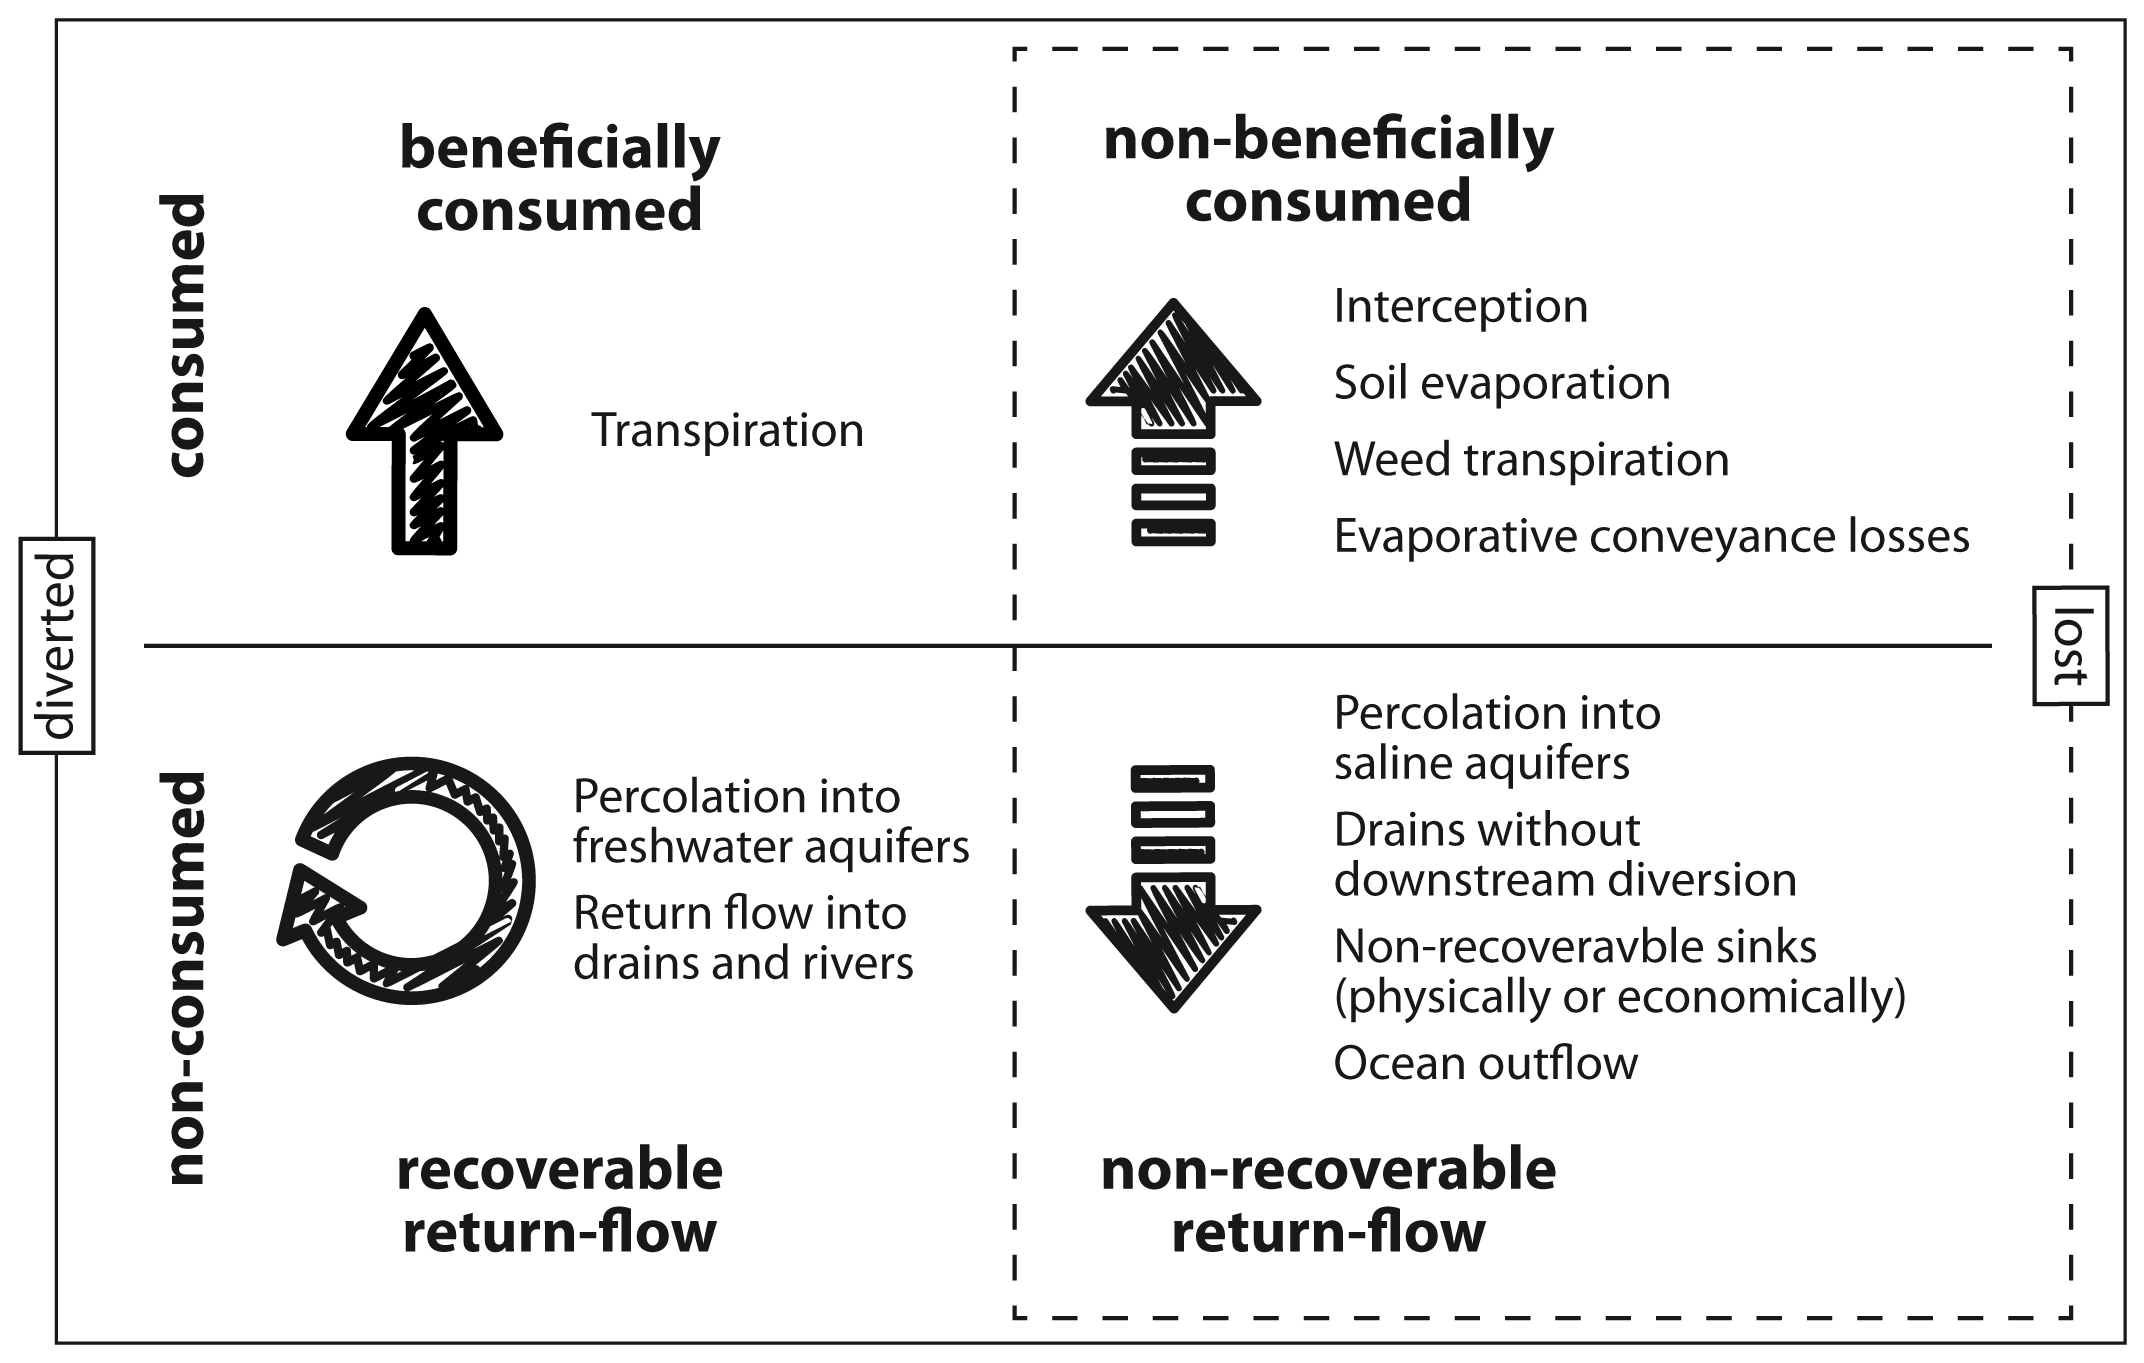
Figure 1.
Pathways of irrigation water fluxes. All diverted water is either consumed (non-)beneficially, or re-enters rivers, reservoirs and aquifers, which makes it recoverable through return flow. Non-beneficial consumption and non-recoverable return flow can be considered losses (at the basin scale).
We implement the three major irrigation systems - surface, sprinkler, and drip - according to their generic characteristics in direct coupling to the model’s soil water balance, which overcomes the earlier scheme of fixed efficiencies as in (Rost et al. 2008). Irrigation systems differ in the way they distribute water across the field. Surface systems (basin and furrow combined) flood the field, sprinkler uses pressurized sprinkler nozzles and micro/drip is the most cost-intensive system using localized water application directly to the plants’ root zone. Indicative efficiency values (Ei) associated with the three system are roughly 30-60, 50-70 and 70-90%, respectively (Brouwer et al. 1989, VanHalsema et al. 2012).
Irrigation water is supplied based on daily soil water deficit. Daily net irrigation requirement (NIR, mm) is requested for withdrawal, if supply (S) falls below demand (D). We define NIR as the amount of water required in the upper 50 cm soil to avoid crop water limitation. It is calculated to meet field capacity:
where wa is the actual available soil water in mm. Due to the above-described system inefficiencies, additional water needs to be requested to meet crop water demand. Therefore, we account for conveyance efficiency and calculate application requirements (AR) for each system, which add up to gross irrigation requirements (GIR, mm), the water amount requested for abstraction (Fig. 2):
where Store is a storage buffer (see below).
For pressurized water transportation (sprinkler and drip), Ec is set to 0.95, as we assume inevitable losses from leakage of 5% (Brouwer et al. 1989). We associate surface irrigation with open canal transportation and we further link Ec to the hydraulic conductivity (Ks) of the soil type. Ec estimates from (Brouwer et al. 1989) are adopted, see Table 1. We assume half of conveyance losses are due to evaporation from water surfaces and the remainder is drainage and added to return flow.
AR is the additional amount of water necessary to distribute irrigation uniformly across the field, indicative of the farmer’s estimate of application losses (that are simulated by the model). We calculate AR as a system-specific scalar of the free water capacity:
where Wsat is soil water content at saturation point, in mm; DU is the water distribution uniformity scalar, depending on the irrigation system (Table 1) and wfw is the available free water (actual soil water content between saturation and field capacity).

Figure 2.
Irrigation water flows in LPJmL from plant-specific net irrigation requirement to actual field application. Variables represented in grey-shaded boxes depend on system-specific parameters that are presented in Table 1.

Surface irrigation systems use large amounts of water to flood the field in order to uniformly distribute water, which results in considerable surface runoff and seepage (Rogers 1997). This is represented through DU=1.15, leading to temporary over-saturation of the field. For sprinkler systems, DU must not be smaller than 0.55 to securely deliver NIR into the upper 50 cm of the soil (Fig. S1). Drip systems apply water localized to the plant and therefore distribution requirements are much lower, with DU=0.05 average yield levels are slightly below the potential (modest form of deficit irrigation), yet allocating salt leaching requirements (Fig. S1).
Daily GIR and HIL add up to the total withdrawal request in each cell. This demand is met from local surface water, including reservoir water and if not sufficient, requested from neighboring upstream cells (Fig. 2 and Biemans et al. 2011). Actually withdrawn irrigation water is always reduced by conveyance losses.
Irrigation scheduling is simulated to be controlled by prec and the irrigation threshold (IT), which defines the allowed degree of soil water depletion prior to irrigation. In sensitivity analyses we found that IT is dependent on the CFT. C4 crops (maize, tropical cereals, sugarcane) are less sensitive to drought stress, because in contrast to C3 crops, they use a more efficient enzyme on the pathway of CO2 fixation (Amthor et al. 1995). The maximum yield for C4 crops is at IT=0.7 (global median, Fig. S2). Values of IT for C3 crops (0.8-0.9) are found to be affected by annual prec; paddy rice is always parameterized with IT=1 (Table 1). Available irrigation water is reduced by available precipitation and the amount that is not released (if S>IT, see Fig. 2) is added to Store (model-internal compensation for local water availability) and kept available until the next irrigation event.
Surface and drip systems are simulated to apply irrigation water below canopy, and sprinkler systems above-canopy with associated interception losses:
where pt is the Priestley-Taylor coefficient (1.32), fv* is the fraction of vegetated soil cover, and wet is fraction of the day with wet leaf surface, calculated as:
where intc is a CFT-specific interception storage parameter (Gerten2004).
Droplet evaporation with sprinkler systems, presumably <1.5% of the applied water (Meyers et al. 1970, Rogers 1997), is implicitly accounted for. Furthermore, we restrict surface runoff for sprinkler systems, such that irrigation water that reaches the soil surface infiltrates and can only run off laterally or percolate into deeper layers.
We design drip systems, in contrast, with a loss-free infiltration into the first two soil layers, i.e. no surface or lateral runoff are subtracted from *Wi**. Soil evaporation losses from drip systems (only blue water) are reduced by 60%, to account for its localized subsurface application of water (Table 1).
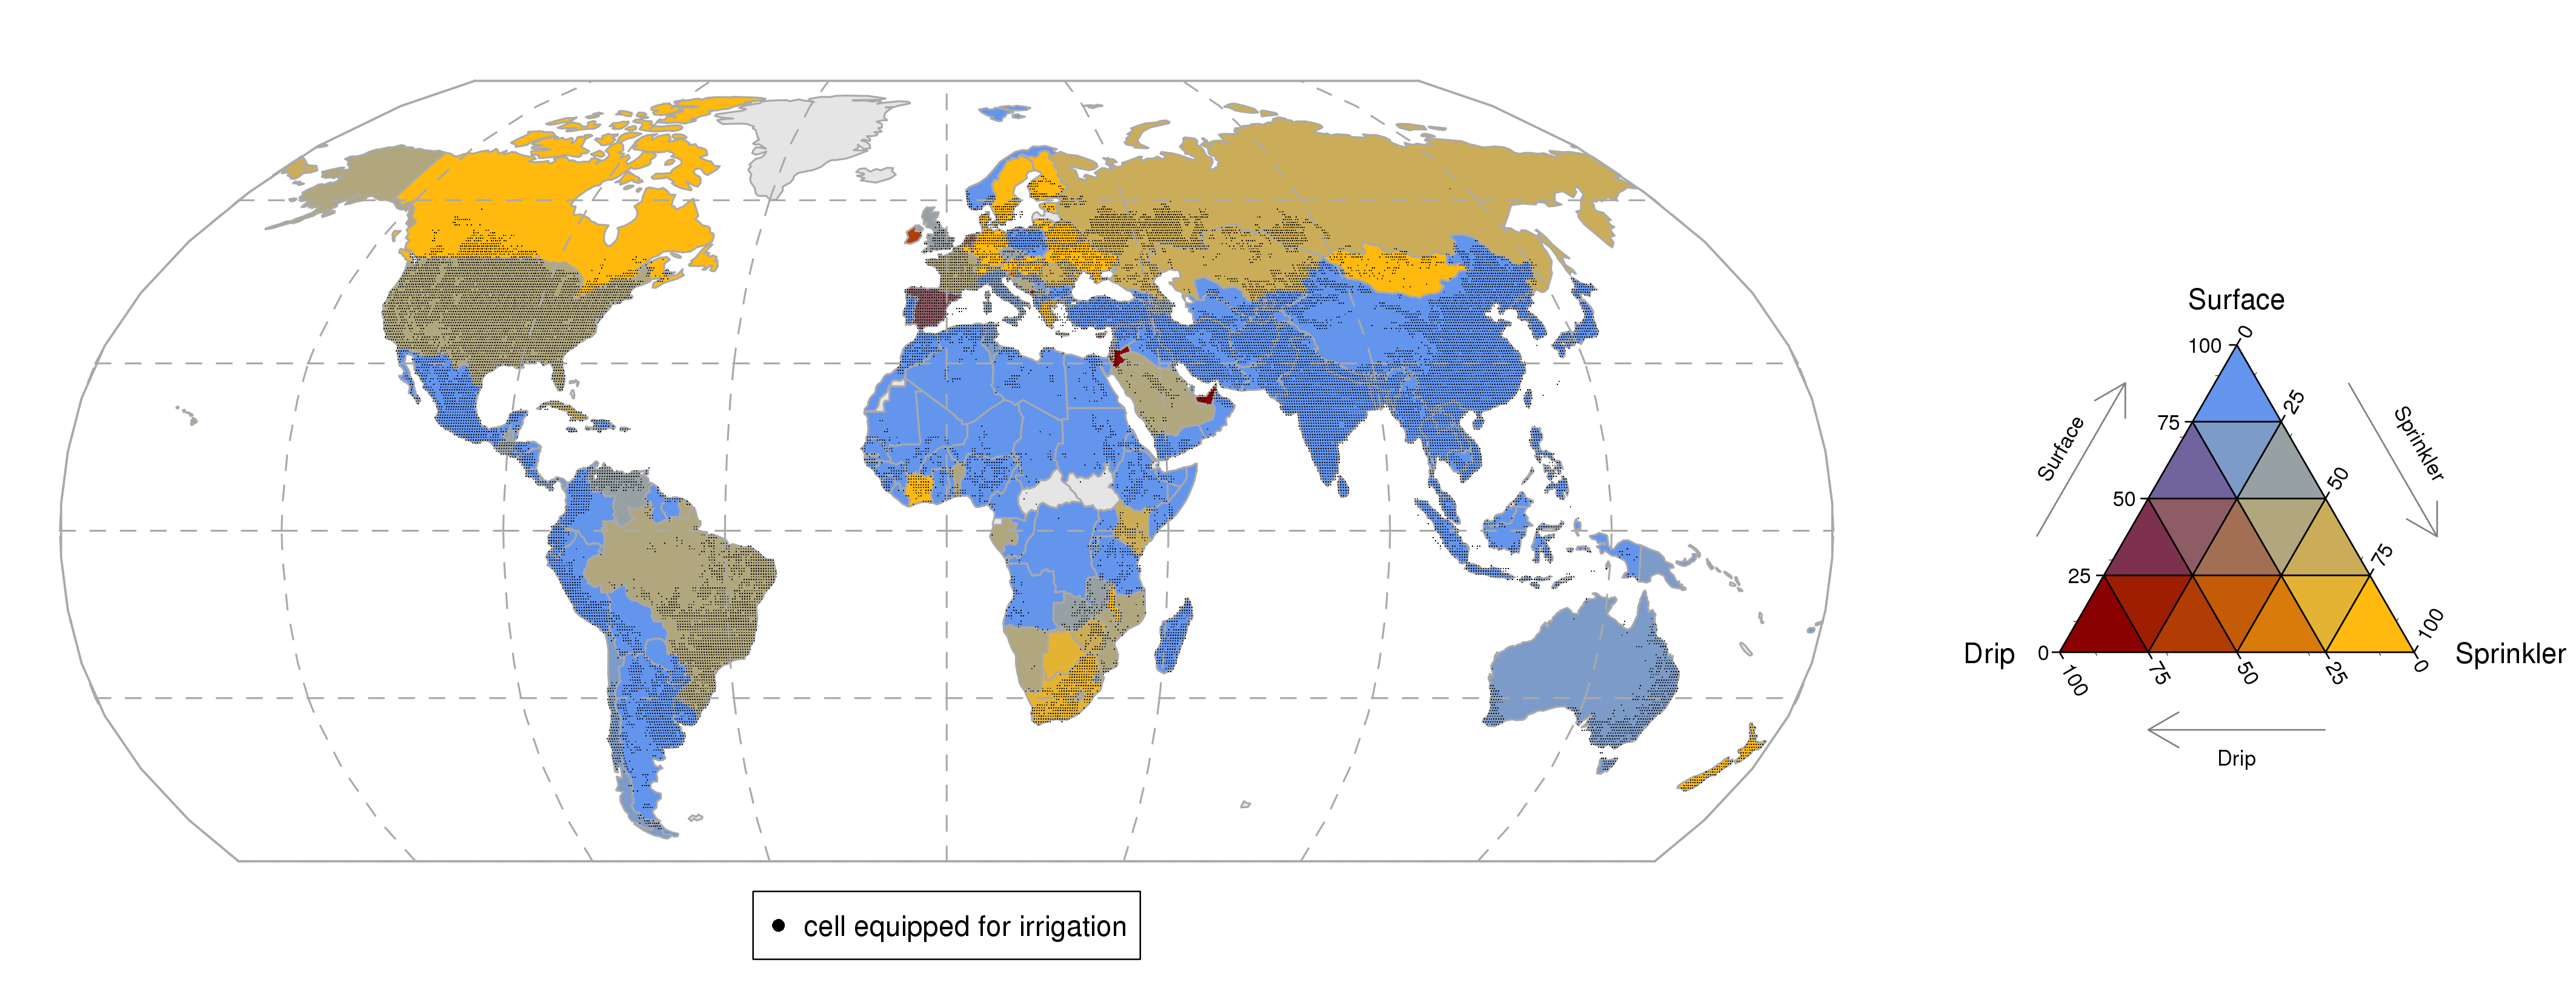
 **Figure 4.**
Global distribution of irrigation systems at country level, based on AQUASTAT statistics. Cells that include irrigated areas are hatched, based on Siebert et al. (2015).
Currently, no sub-regional information on the global distribution of irrigation systems is available, which would provide the missing link to more accurate simulations of irrigation water requirements and performances. We therefore develop a new dataset of the global distribution of irrigation systems, for each grid cell and CFT (Fig. 4). Country-level shares of irrigation systems can be associated with a series of socio-economic and biophysical factors. A comprehensive explanation of these patterns is beyond the scope of this study, and here we simply adopt national statistics from AQUASTAT (FAO 2014). Each country is assigned the respective share of the three irrigation systems (Table S1), which we further disaggregate to the grid cell and the CFTs through a decision tree approach, using the extent of irrigated areas by CFT (Porkka et al. in prep., Siebert et al. 2015) and an irrigation system suitability table. The CFT suitabilities for each irrigation system (Table 2) are determined based on restrictions due to soil type, the CFT-specific tolerance toward moisture depletion, the characteristic planting and harvesting techniques, the specific physical habit of the crop, and its economic market value (e.g. low market value crops are excluded from drip irrigation); based on (Sauer et al. 2010) and (Fischer et al. 2012). The distribution of irrigation systems is adjusted annually (see SI for further details).

- Biemans, H., Haddeland, I., Kabat, P., Ludwig, F., Hutjes, R. W. A., Heinke, J., von Bloh, W., and Gerten, D.: Impact of reservoirs on river discharge and irrigation water supply during the 20th century, Water Resour. Res., 47, W03509, doi:10.1029/2009WR008929, 2011.
- Brouwer, C., Prins, K., and Heibloem, M.: Irrigation Water Management : Irrigation Scheduling. Training manual no. 4, Tech. Rep. 4, FAO Land and Water Development Division, Rome, Italy, 1989.
- FAO: AQUASTAT database, Food and Agriculture Organization of the United Nations (FAO), http://www.fao.org/nr/water/aquastat/ data/query/index.html?lang=en (last access: 18 October 2014), 2014.
- Fischer, G., Nachtergaele, F., Prieler, S., Teixeira, E., To?th, G., van Velthuizen, H., Verelst, L., and Wiberg, D.: Global Agro- ecological Zones (GAEZ v3.0), Tech. rep., IIASA/FAO, IIASA, Laxenburg, Austria and FAO, Rome, Italy, 2012.
- Gerten, D., Schaphoff, S., Haberlandt, U., Lucht, W., and Sitch, S.: Terrestrial vegetation and water balance–hydrological evaluation of a dynamic global vegetation model, J. Hydrol., 286, 249–270, doi:10.1016/j.jhydrol.2003.09.029, 2004.
- Jägermeyr, J., Gerten, D., Heinke, J., Schaphoff, S., Kummu, M., & Lucht, W. (2015). Water savings potentials of irrigation systems: dynamic global simulation. Hydrology and Earth System Sciences Discussions, 12(4), 3593–3644. doi:10.5194/hessd-12-3593-2015.
- Meyers, J., Baird, C., and Choate, R.: Evaporation losses in sprin- kler irrigation, Tech. Rep. 1968, Florida Water Resources Re- search Center, Gainesville, FL, USA, 1970.
- Porkka, M., Gerten, D., Schaphoff, S., Siebert, S., and Kummu, M.: Causes and trends of global historical green-blue water scarcity in food production, in preparation, 2015.
- Rogers, D., Lamm, F., Alam, M., Trooien, T., Barnes, G. C. P., and Mankin, K.: Efficiencies and water losses of irrigation systems, Irrig. Manage. Syst., 1997.
- Rohwer, J., Gerten, D. und Lucht, W. (2007): Development of irrigation functional types for improved global crop modelling. PIK Report 104.
- Rost, S., Gerten, D., Bondeau, A., Lucht, W., & Rohwer, J. (2008). Agricultural green and blue water consumption and its influence on the global water system. Water Resources, 44, 1–17. doi:10.1029/2007WR006331
- Sauer, T., Havli?k, P., Schneider, U. A., Schmid, E., Kindermann, G., and Obersteiner, M.: Agriculture and resource availability in a changing world: The role of irrigation, Water Resour. Res., 46, W06503, doi:10.1029/2009WR007729, 2010.
- Siebert, S., Kummu, M., Porkka, M., Do?ll, P., Ramankutty, N., and Scanlon, B. R.: A global data set of the extent of irrigated land from 1900 to 2005, Hydrol. Earth Syst. Sci., 19, 1521–1545, doi:10.5194/hess-19-1521-2015, 2015.
- van Halsema, G. E. and Vincent, L.: Efficiency and productiv- ity terms for water management: A matter of contextual rela- tivism versus general absolutism, Agr. Water Manage., 108, 9– 15, doi:10.1016/j.agwat.2011.05.016, 2012.
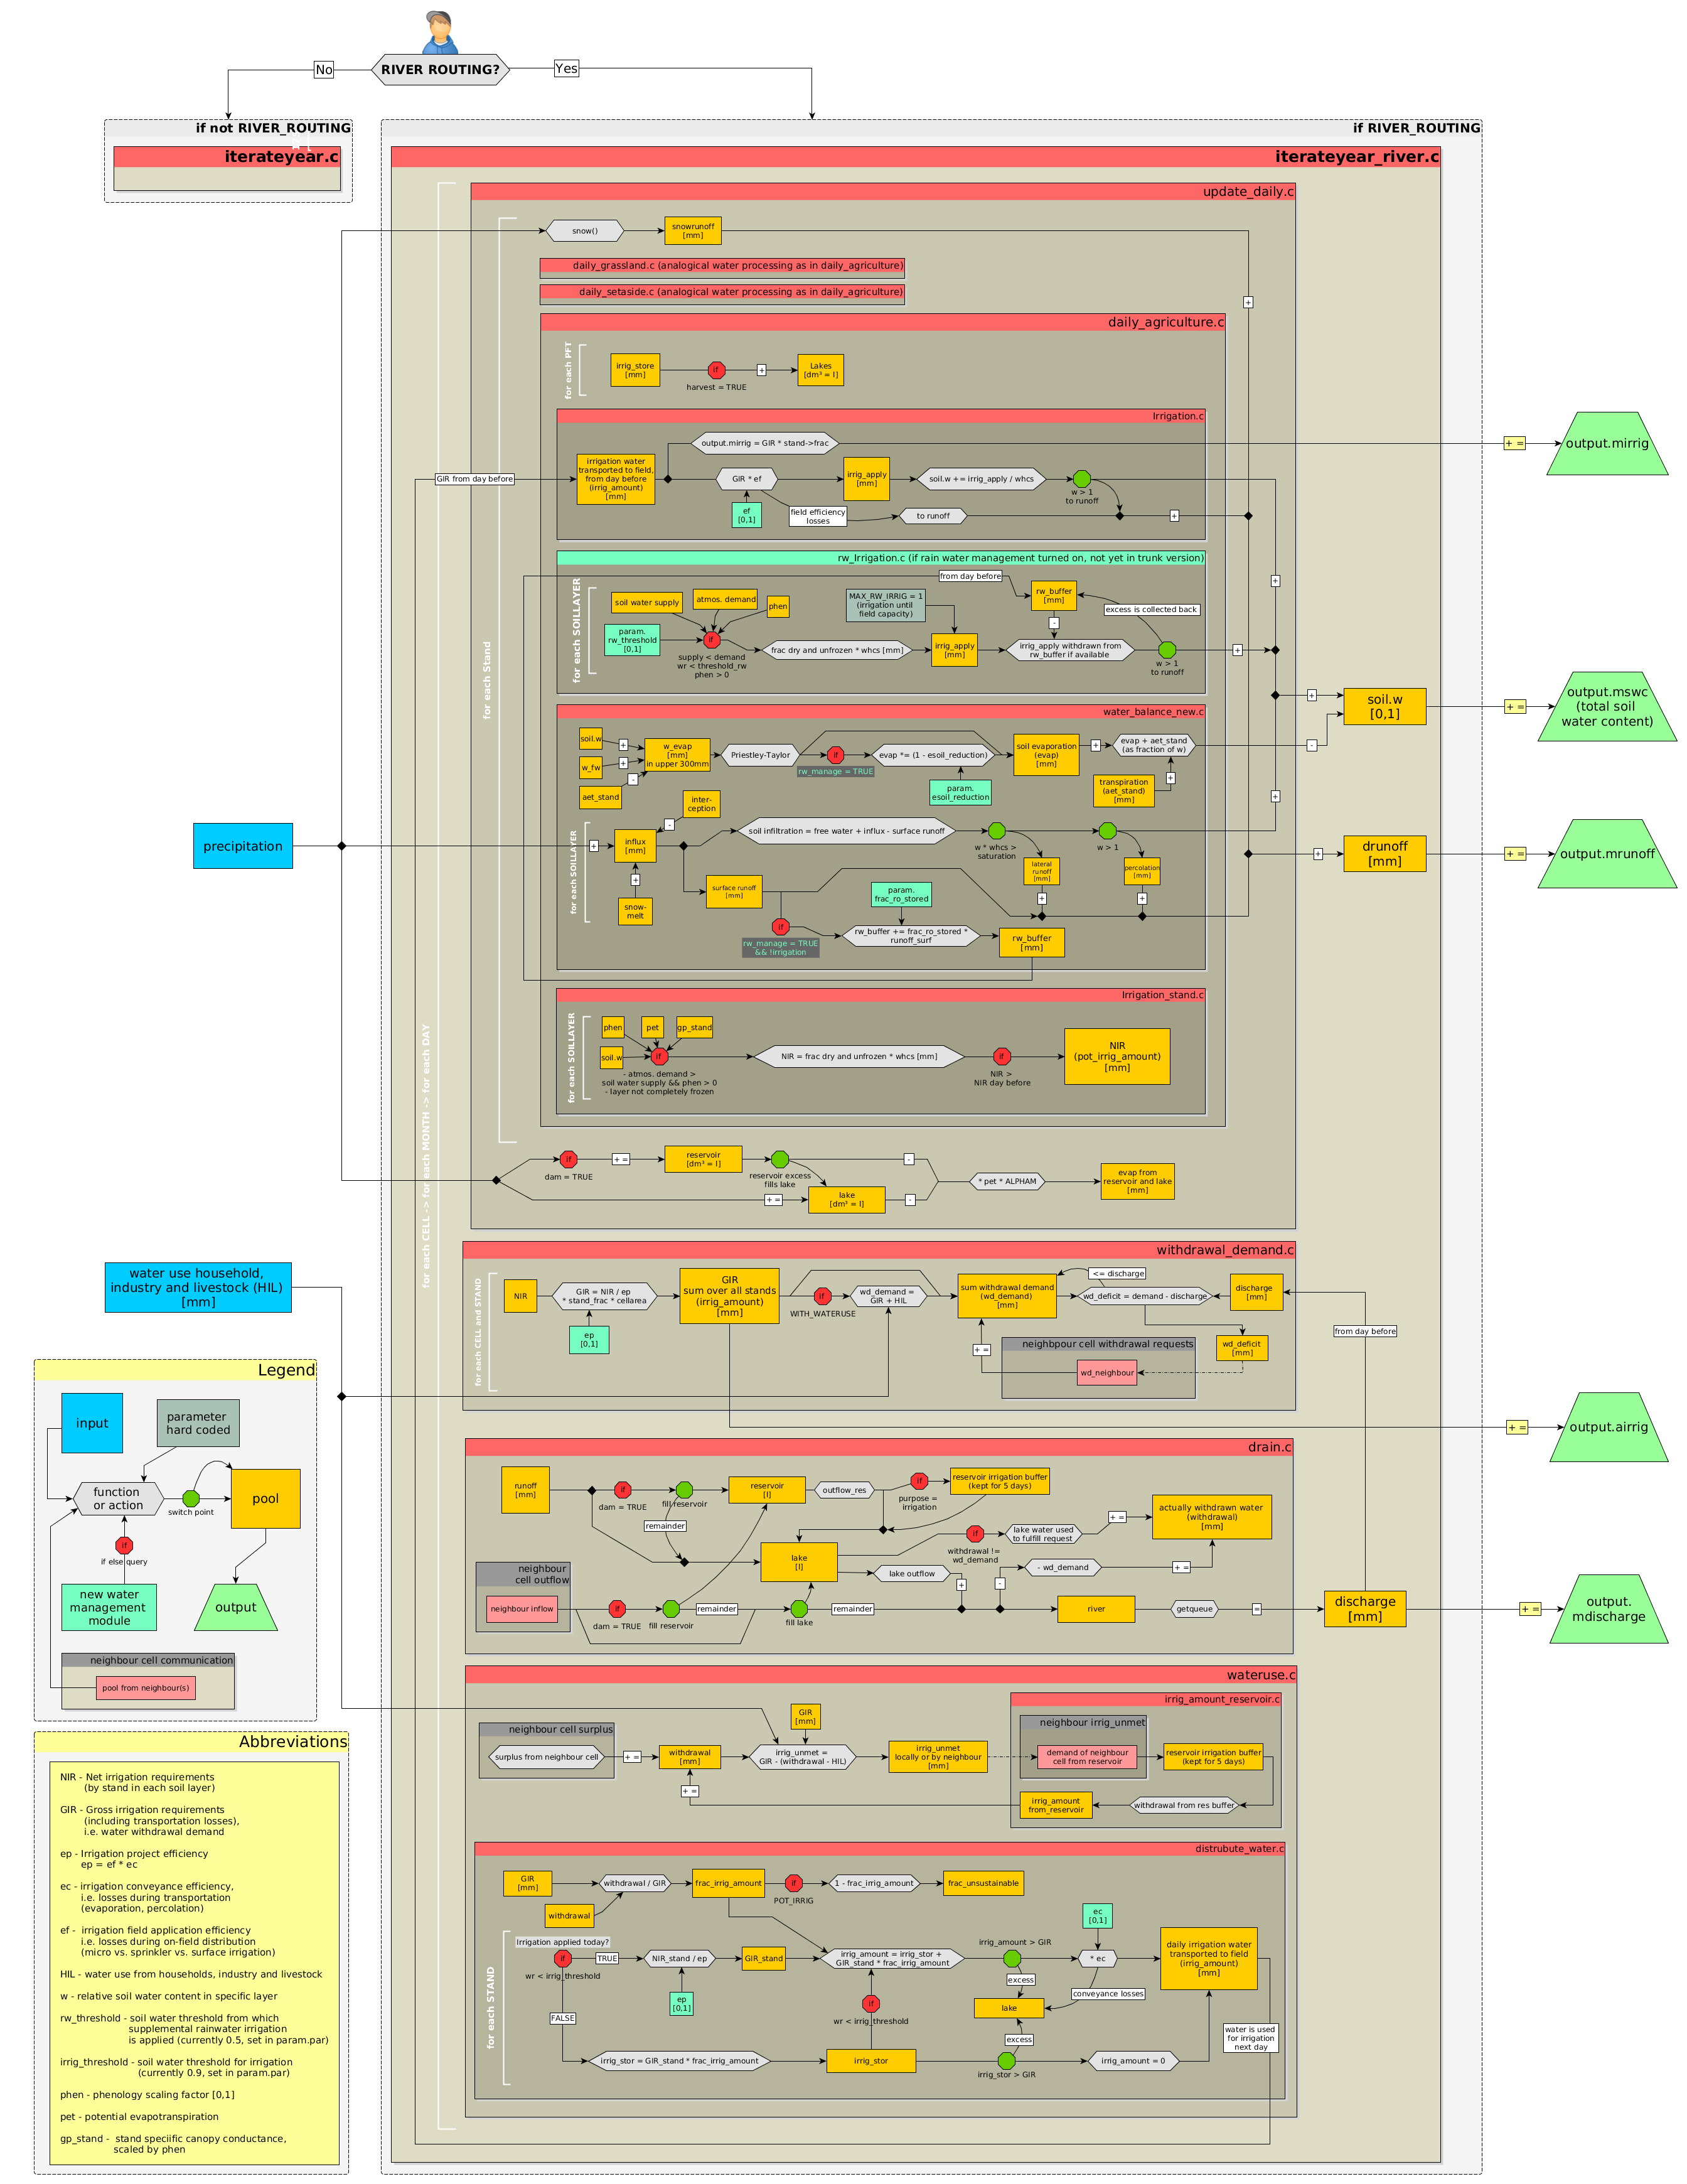
 **Figure 5.**
Flowchart of the soil water and irrigation processes. This frame includes new water management measures that are currently not yet part of the trunk version.