Advanced mode
The advanced mode lets you create charts with code instead of using the more user-friendly interactive mode. It is only compatible with charts, not maps.
If you're a beginner, we do not recommend using it, as it requires advanced knowledge of the underlying charting library Vega.
The advanced mode can be enabled by:
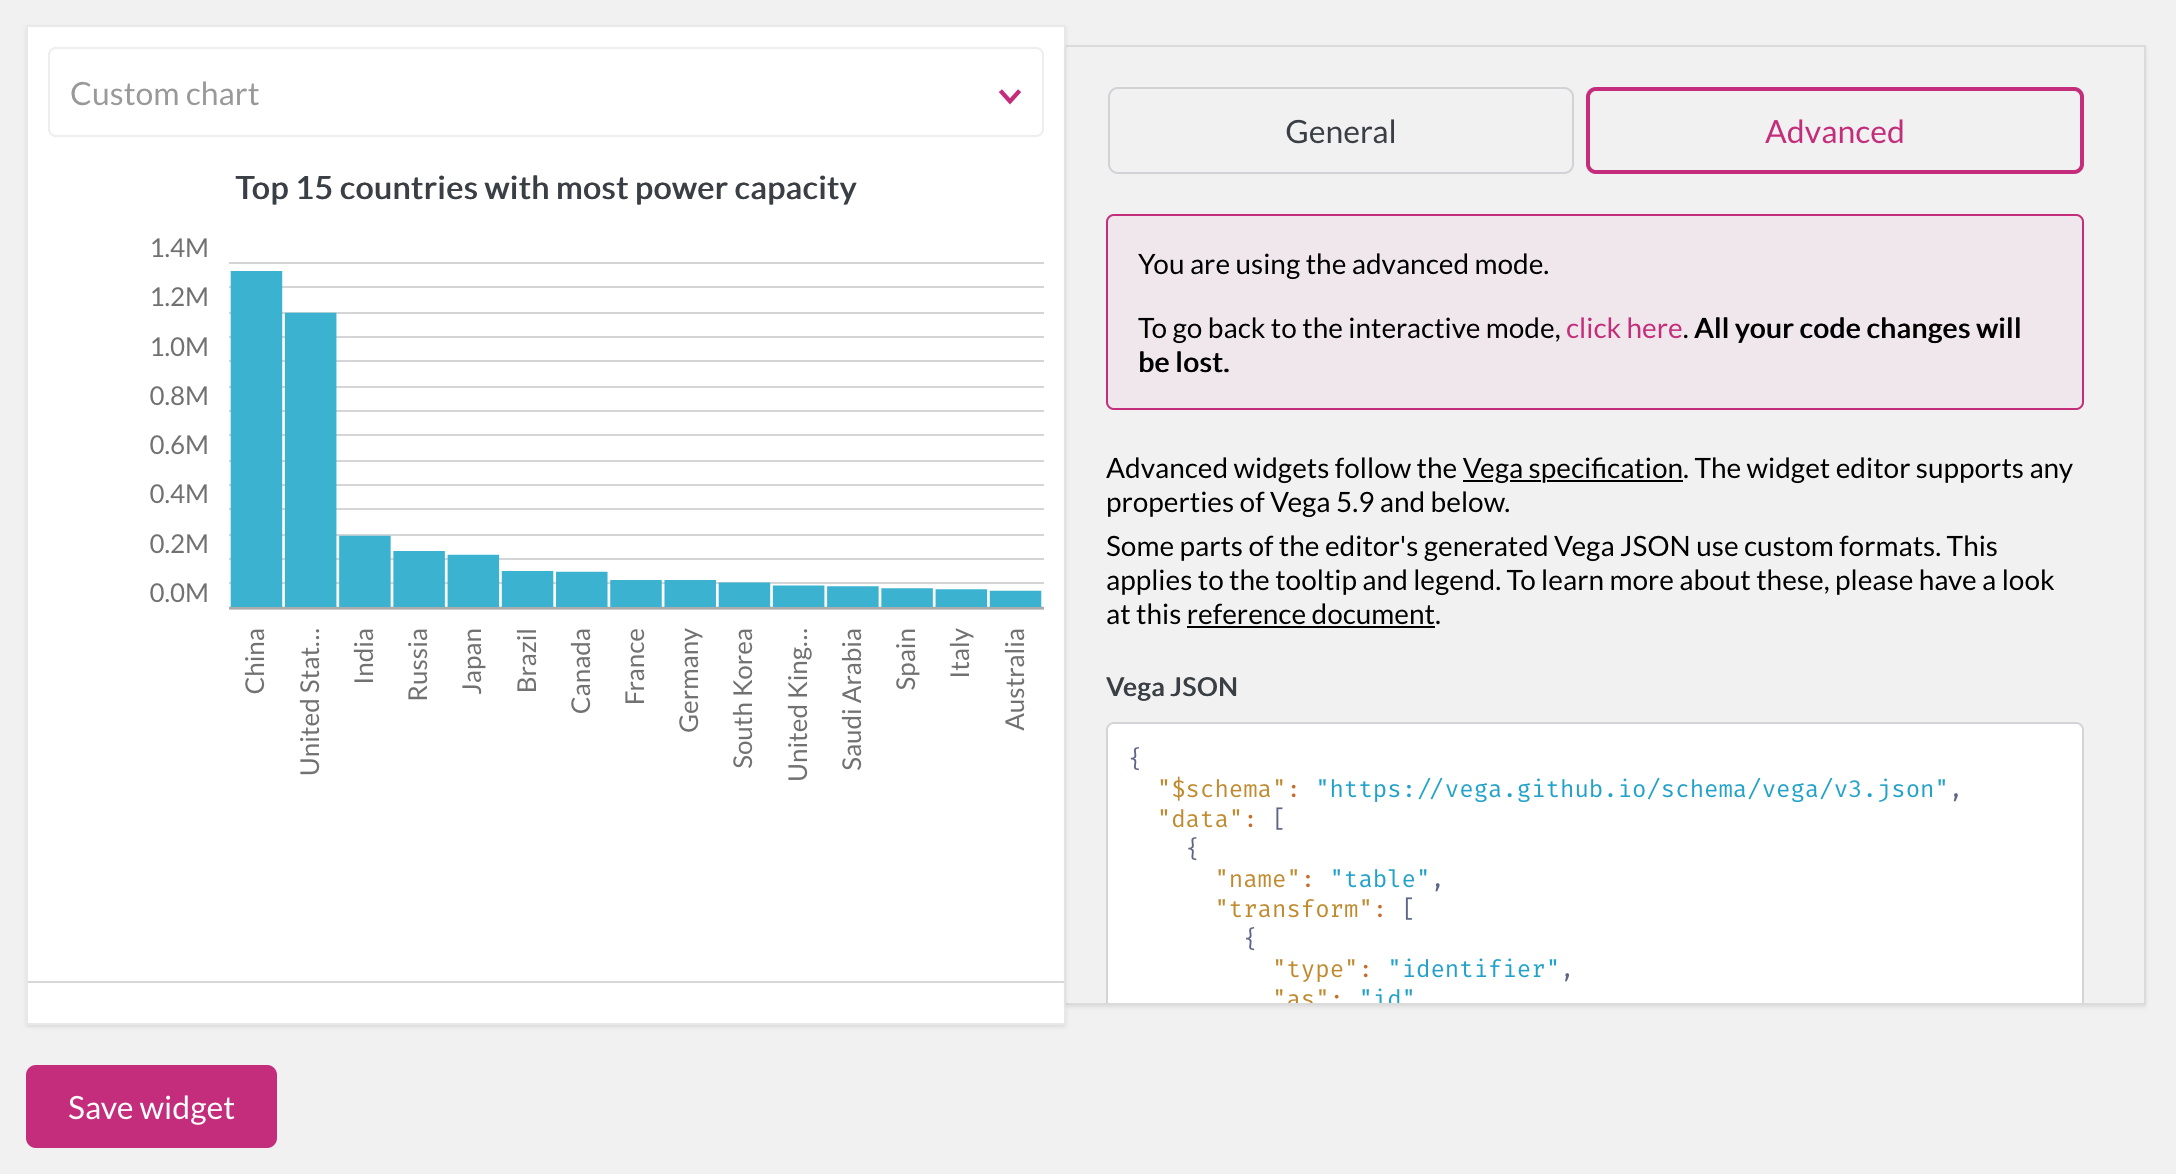
- Selecting the “Advanced” tab of the settings panel
- Clicking the “Switch to the advanced mode” button
Please note that when switching modes, settings may be lost because most of them are not translatable from one mode to the other.
Before anything, make sure you are familiar with Vega and that you have read the developer documentation about the widgets' specification. Though most of the chart definition follows the Vega specification, some parts are custom and explained in this document.
To create an advanced widget, we would recommend that you start by creating a chart using the interactive mode, and then switch to the advanced mode. This way, you will already have most of the code ready.
Then, feel free to update the specification as you wish, provided that you respect the widgets' specification. There are, for example, strict rules about the legend, interaction_config and config objects. Others such as we_meta and paramsConfig should not be defined.
If you make changes that are not permitted, an error will be displayed at the top of the code editor. Refer to the widgets' specification document for more information.
There are no button to manually update the visualization. Instead, just wait for about a second after your latest change, and the visualization will update or an error will appear.